-
Notifications
You must be signed in to change notification settings - Fork 0
Setting up ChartIO to visualize Snowplow data
HOME > SNOWPLOW SETUP GUIDE > [Step 5: Get started analysing Snowplow data](Getting started analyzing Snowplow data) > Setting up ChartIO
## Contents- What is ChartIO, and why use it to analyze / visualize Snowplow data
- Setting up a ChartIO account
- Connecting ChartIO to Snowplow data in Redshift
- Connecting ChartIO to Snowplow data in Infobright
- Creating your first Snowplow dashboard in ChartIO
- Next steps
ChartIO ChartIO is a fantastic BI tool that has a number of attractive features, especially for people who want to graph Snowplow data sources quickly:
- It is very simple and straightforward to setup and use. Most BI tools require users to invest in formatting data in their data warehouse in a specific way and / or configuring the way the data from a warehouse is ingested by the BI tool, so that the BI tool knows how to present the data to users via its UI. ChartIO takes a much simpler approach: it lets users query underlying data sources directly (by explicitly entering SQL commands) and then graph the results directly via a web UI. No fiddling around with any metadata editors required.
- It is a SaaS solution, so minimal software to setup and install.
- It is secure, using SSH to establish a secure connection between Snowplow data and the ChartIO webapp.
-
Go to the [ChartIO website] ChartIO, and setup a trial account by clicking the [Try it Free] trial button on the homepage. Enter an email address and password to sign up.
-
Enter a company name and project name in the next screen, then select 'Create Project'.
Now, if your Snowplow data is in Redshift, read on. If your Snowplow data is in Infobright, proceed to section 4.
## 3. Connecting ChartIO to Snowplow data in RedshiftBefore you setup your connection between ChartIO and Redshift, we recommend that you create a read-only user in Redshift. We'll then use these credentials to establish the connection.
To create a read only user, login to Redshift using your preferred SQL client (you can use psql) using super-user account details (the ones you created with your cluster). E.g. if you're using psql, you'd enter something like the following (changing the host and database name as appropriate.)
psql -d snowplow -h snowplow.cjbccnwghslt.us-east-1.redshift.amazonaws.com -p 5439 -U admin
Now create your read only user:
CREATE USER chartio PASSWORD 'my-password-inc-one-capital-at-least-8-chars' NOCREATEDB;
Now grant permissions to that user so he / she can read the relevant tables:
GRANT USAGE ON SCHEMA atomic TO chartio;
GRANT SELECT ON atomic.events TO chartio;
GRANT USAGE ON SCHEMA customer_recipes TO chartio;
GRANT SELECT ON customer_recipes.referers_basic, customer_recipes.visits_basic, customer_recipes.visits_with_entry_and_exit_pages, customer_recipes.visits_with_referers TO chartio;
GRANT USAGE ON SCHEMA catalog_recipes TO chartio;
Note: if there are other tables the user needs to access, you should grant select permission to those as well.
Amazon Redshift will only allow clients on whitelisted IP addresses to connect.
To whitelist the ChartIO IP address, log into your AWS console and navigate into Redshift.
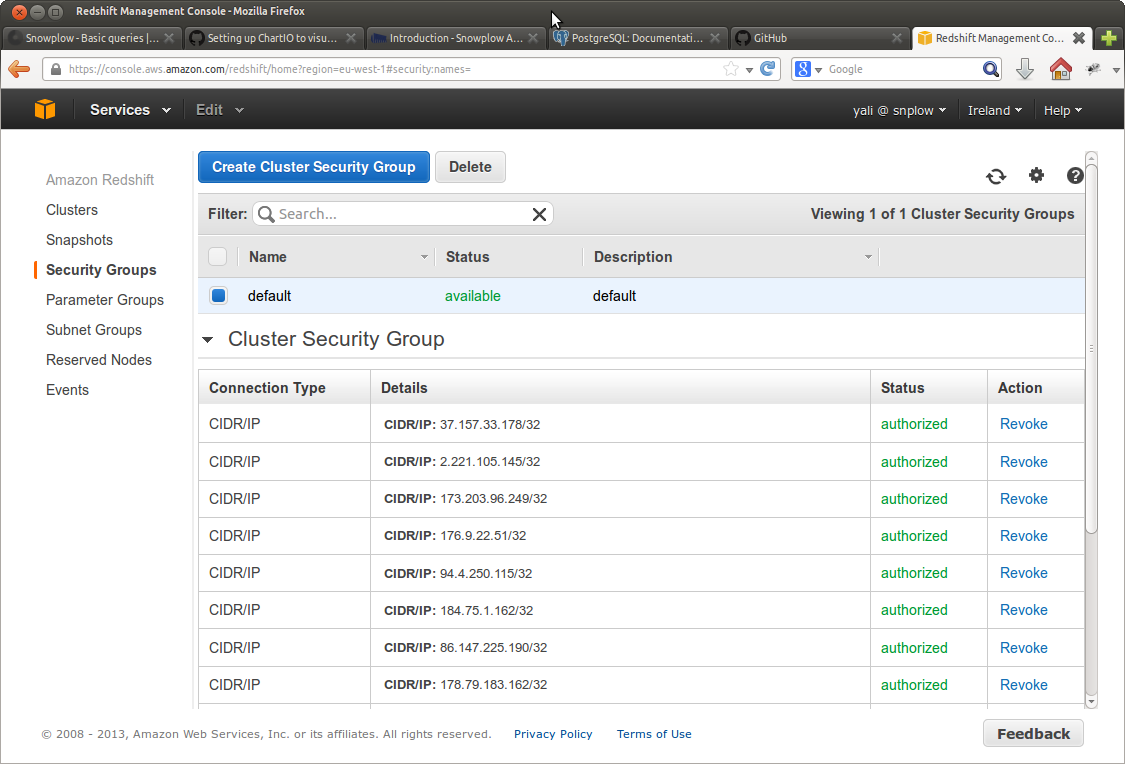
Click on the "Security Groups" option on the left hand menu and select your security group. (This is normally 'default'). Amazon gives you the option to add a new connection type: select "CIDR/IP" from the drop down and then enter the ChartIO IP address 173.203.96.249/32. Click the "add": you should see a screen like the one below, with the ChartIO IP address listed as one of the options.

Log in to ChartIO. Open your project.

Click on the 'Settings' menu (click on the top right button and then on Settings) in the menu that appears on the right. Select Add a New Data Source.

Select Amazon Redshift.
Enter your Redshift credentials as appropriate. We can fetch these details directly from the AWS console. Log into [console.aws.amazon.com] [aws-console], select Redshift from the list of services and then select the Redshift cluster you want to connect to. The details of the cluster you need to connect Tableau are listed under Cluster Database Properties:
- Copy the database end point from the AWS console and paste it into the Host field in CharIO
- Copy the port number from the console into ChartIO
- Copy the database name (this can be fetched from the console)
- Enter 'atomic' as the schema name
- Enter the login details (name and password) for the readonly user you created for Redshfit. (These details are not listed in the console.)
/setup-guide/images/chartio/cr3.PNG
You may want to reduce the query cache duration. We set ours to 3 hours - as we only run the ETL proces once every three hours.
Click 'Test Connection and Save'. Your connection should be setup! Proceed to step 5: creating your first Snowplow dashboard in ChartIO.
Now proceed to step 5: creating your first dashboard.
NOTE! You have only created a connection in ChartIO to the events table in the atomic schema. To access the Snowplow views (in e.g. customers_recipe schema), you would need to setup an additional connection for each schema, with the same details as those above but changing the schema field to e.g. customer_recipes, catalog_recipes etc.
We now need to create a connection between ChartIO and Snowplow data, stored on Infobright. To establish a connection, we use the fact that Infobright is a fork of MySQL, and so ChartIO can connect to Infobright as it would to MySQL.
With that in mind click on the MySQL button in the ChartIO UI. We recommend using the 'Tunnel Connection Method'. Select this button: ChartIO displays a page with instructions on how to setup a connection server-side. We repeat the instructions below, but make them Snowplow specific:
SSH into your server running Infobright. You need to install ChartIO onto this server. If you have pip, simply execute:
$ sudo pip install chartio
at the command line to install ChartIO. Alternatively if you have easy_install:
$ sudo easy_install chartio
If you have neither you can download chartio manually:
$ wget https://chartio.com/static/src/chartio-2.0.4.tar.gz
then decompress the download:
$ tar xvzf chartio-2.0.4.tar.gz
and then install it:
$ cd chartio-2.0.4
$ sudo python setup.py install
Before we run the chartio_setup to establish the connection we need to ensure that we have MySQL installed on the server. (Because chartio_setup uses mysql rather than mysql-ib to establish the connection.) To check if you have MySQL installed (as well as Infobright), run
$ which mysql
If you get back the path to MySQL you have MySQL and can skip to the next step. (E.g. /usr/bin/mysql.) If you do not get back a path, you'll need to install MySQL by executing the following command:
$ sudo apt-get install mysql-server mysql-client libmysqlclient-dev
Now run chartio_setup at the command line:
`chartio_setup`
The setup wizard will prompt you to select a type of database to connect to. Enter 1 for MySQL.
The setup wizard will prompt you to enter a port number for the database. Enter 5029. (The default port for Infobright.)
When prompted to enter the database name to connect to, you can leave this option blank. (ChartIO will later list all the databases available so you can select the one you use for Snowplow.)
When prompted, enter your database administrator name and password. ChartIO will use this to log onto your database, create a user with read only access to your Snowplow data, and make that user the one for whom an SSH connection is established to the ChartIO webapp.
ChartIO should now list all the databases on Infobright. Select the one you use for Snowplow.
When prompted to enter an existing read-only role, leave blank. (So ChartIO creates a new role.)
You should see something like the following displayed:
Enter an existing read-only role for Chartio to use
    [Leave blank to create a new role automatically]
Read-only role name:
==> Creating read-only user 'chartio_pbz305'
==> Finished configuring database information
==> Launching chartio_connect
chartio_connect daemonized as process 25762
==> chartio_connect running
==> Registering datasource with Chartio. This will take a moment.
==> Datasource registered. chartio_connect is running.
When prompted whether you would 'like a crontab entry added to reconnect to Chartio on reboot? [y/n]:` select 'Y'. You should see something as follows, to indicate that the connection has been setup successfully:
Visit your dashboard at
  https://chart.io/project/6431/dash/
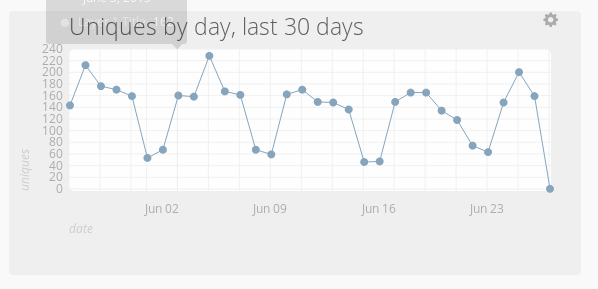
Now that we have a data connection setup between Snowplow and ChartIO, we can start graphing Snowplow data. ChartIO makes this very easy. To demonstrate, we'll create a graph that shows the number of unique visitors and visits to our website in the last 4 weeks:
Create a new dashboard in ChartIO. Go into it, and click on the Add a Chart button on the top right of the screen. ChartIO presents you with a set of options for creating your graph:

ChartIO offers two ways to create new graphs: an "Interactive Mode", where you drag and drop columns in your table onto the Measures and Dimensions panes, and a "Query Mode", where you can enter SQL queries directly. We're going to use "Query Mode" - so click on this option (under "Layer 1 Title").
Click on the "Custom Query" box and enter the following query, which counts the number of unique visitors by day to our website, for the last 30 days:
SELECT
TO_CHAR(collector_tstamp, 'YYYY-MM-DD') as "Date",
COUNT(DISTINCT(domain_userid)) as "Uniques"
FROM events
WHERE collector_tstamp > CURRENT_DATE - INTEGER '31'
GROUP BY "Date"
ORDER BY "Date"
Click on the Chart Query button below. The results of the query should display in a table above it:

We want to plot a line graph showing the trend over time. This is easy: simply click on the line graph icon, to the right of the table.
We can give out chart a title, by clicking on "Chart Title" on the top left of the screen and entering one e.g. "Uniques by day, last 30 days"

Now click save (top right). Our new chart appears on our new dashboard. We can its size and position, simply by dragging it round the screen. We can create a 2nd graph, by clicking the Add a Chart button again. Simple!

Up and running with ChartIO on top of Snowplow? Visit the Analytics Cookbook to find out about more ways to drive value from Snowplow data.
Return to getting started analysing your Snowplow data.
Return to the setup guide.
Home | About | Project | Setup Guide | Technical Docs | Copyright © 2012-2013 Snowplow Analytics Ltd
HOME > SNOWPLOW SETUP GUIDE > Step 5: Getting started analysing Snowplow data
- [Step 1: Setup a Collector] (setting-up-a-collector)
- [Step 2: Setup a Tracker] (setting-up-a-tracker)
- [Step 3: Setup EmrEtlRunner] (setting-up-EmrEtlRunner)
- [Step 4: Setup the StorageLoader] (setting-up-storageloader)
- [Step 5: Analyze your data!] (Getting started analyzing Snowplow data)
- [5.1: setting up the default recipes and cubes] views
- [5.2: setting up Looker to visualize your data] looker
- [5.3: setting up ChartIO to visualize your data] chartio
- [5.4: setting up Excel to analyze and visualize your data] excel
- [5.5: setting up Tableau to perform OLAP analysis on your data] tableau
- [5.6: setting up R to perform more sophisticated data analysis] r
- [5.7: get started analyzing your data in EMR and Hive] (getting-started-with-EMR)
- [5.8: using Qubole to analyze your data in S3 using Hive and Pig] (Setting-up-Qubole-to-analyze-Snowplow-data-using-Apache-Hive)
Useful resources
