-
Notifications
You must be signed in to change notification settings - Fork 0
Raspberry Pi Network
Each behavioral station will be controlled by a Raspberry Pi 4 and one camera will be used for quantifying movement using optic flow.
We gain access to the raspberries through the local network (using either SSH or VNC protocols). You can find VNC Viewer here. If you are trying to use VNC viewer from an Android device, you can find it on the play store.
Our aim is to setup the raspberries in a way that allows us to always know the mac address and IP of each Raspberry Pi.
To setup the rasbperries, follow the information on setup.
After setup, every Raspberry Pi is scheduled to send mac and IP information to the central computer. We can use that information to visualize the experiment and control stations.

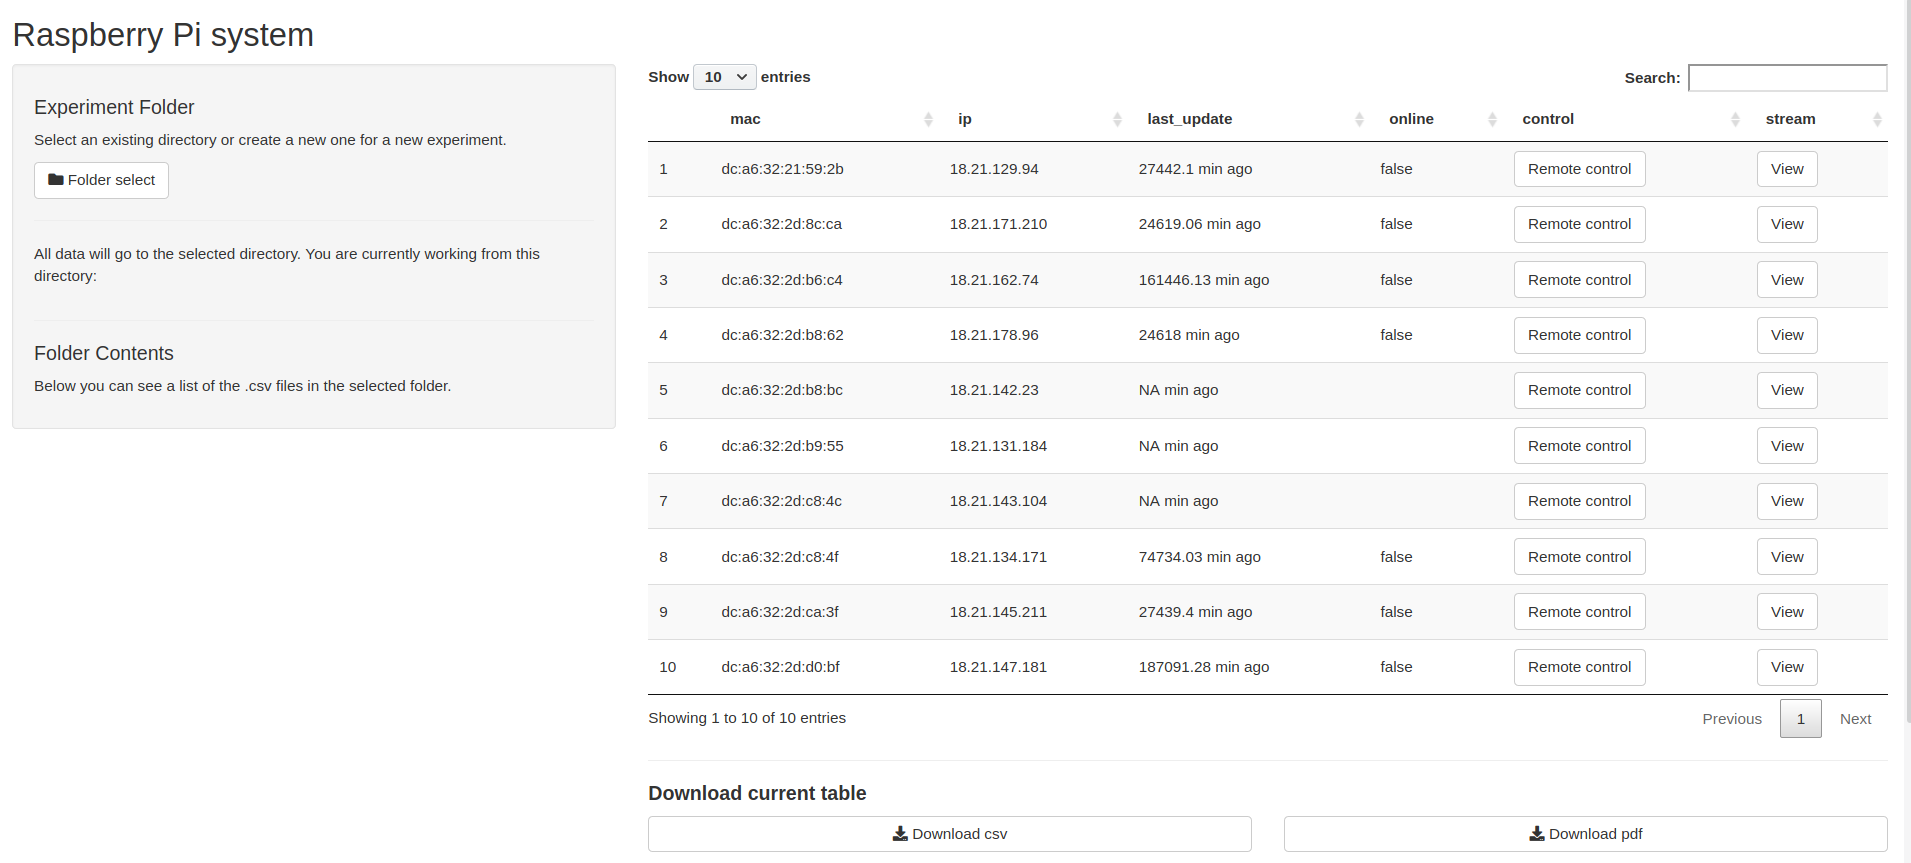
A convenient way to view, control, and pool data from the network is using the app.
You can find the code for this Shiny app on this repository. You can run it from Rstudio or from a browser directly (use this desktop entry for a quick double-click into the app shortcut!).
IMPORTANT: This app must run from the folder that receives info from the units (e.g.,
/home/choilab/raspberry_IP/).
As of August 2020, these are the packages this app needs to run. Before trying it out, install the needed dependencies into R:
library(shiny)
# we need dplyr 0.8.99.9 version or older..
library(tidyverse)
library(DT)
library(shinyFiles)
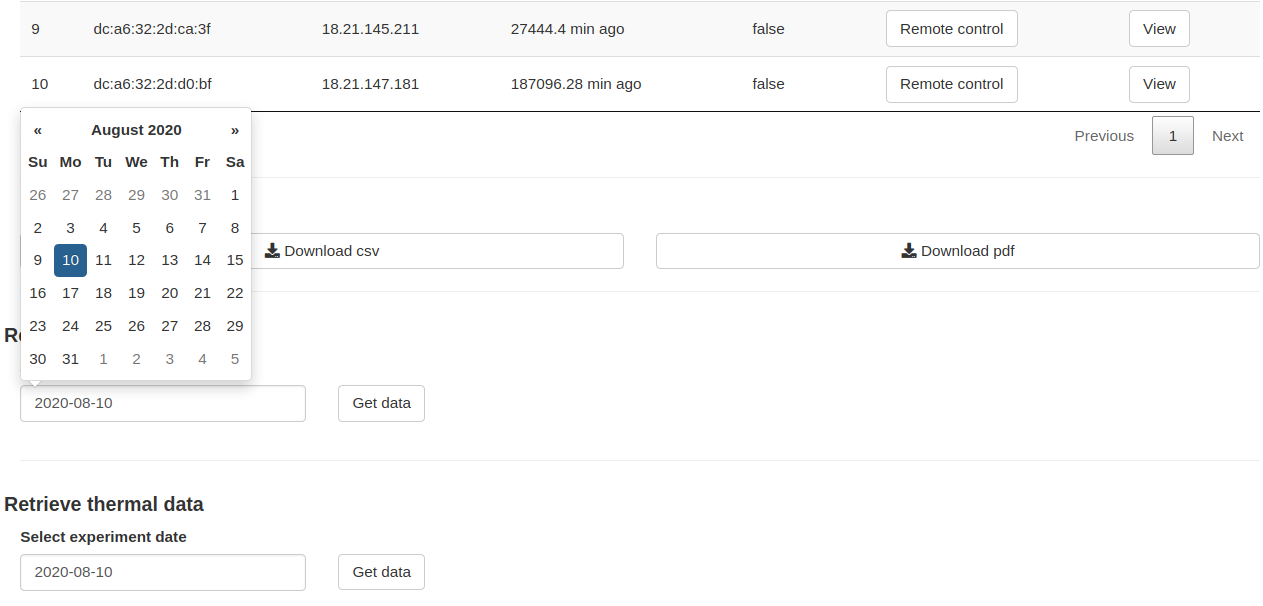
The app will allow you to:
- See the information for the raspberry network
- Remotely control each unit
- Visualize whether each unit is online and access their stream
- Print the RPi network info into
.csvor.pdfformats - Pool movement data into a specified folder for a particular date
- Pool thermal data for a particular date. Data will go into the designated folder in
send_thermal_data.py(e.g.,/home/choilab/raspberry_IP/).


