LibreNMS is not very plentiful with their example alerts. It took me a significant amount of time to come up with the following alerts so I thought I would create a repository to retain them in the event that I need to rebuild my LibreNMS server in the future. Or, of course, so others could see my examples as well.
This table holds all of my example LibreNMS alerts.
| # | Name | Rule | Severity | Extra |
|---|---|---|---|---|
| 1 | Host has been down for 5 minutes. | %macros.device_down = "1" | critical | Max: 1 Delay: 300 Interval: 1800 |
| 2 | CPU usage > 90% for 5 minutes. | %processors.processor_usage >= "90" | warning | Max: 1 Delay: 300 Interval: 900 |
| 3 | Memory usage > 90% for 5 minutes. | %mempools.mempool_perc >= "90" | warning | Max: 1 Delay: 300 Interval: 900 |
| 4 | Root filesystem has less than 5% free space available. | %storage.storage_descr = "/" && %storage.storage_perc >= "95" | critical | Max: 1 Delay: 60 Interval: 900 |
| 5 | Disk usage is abnormally high. | %storage.storage_perc > %storage.storage_perc_warn && %devices.type = "server" && %storage.storage_descr !~ "/boot" = "" | critical | Max: 1 Delay: 60 Interval: 900 |
| 6 | AUTHENTICATION FAILURE!!!!!!! | %syslog.msg ~ "@authentication failure@" = %syslog.timestamp >= %macros.past_5m | critical | Max: -1 Delay: 300 Interval: 300 |
| 7 | Network usage > 80% for 5 minutes. | %macros.port_usage_perc >= "80" && %port.port_descr_type != "client" && %ports.ifType != "softwareLoopback" | ok | Max: -1 Delay: 300 Interval: 300 |
| 8 | CPU Latency > 500ms for 1 minute. | %device_perf.avg >= "1000" | critical | Max: 1 Delay: 60 Interval: 900 |
| 9 | Network usage > 2MBps for 5 minutes. | %ports.ifHighSpeed >= "2" | ok | Max: 1 Delay: 300 Interval: 900 |
| 10 | Device discovered within the last 60 minutes | %eventlog.type = "discovery" && %eventlog.message ~ "@autodiscovered@" && %eventlog.datetime >= %macros.past_60m | ok | Max: 1 Delay: 0 Interval: 300 |
| 11 | Host has been rebooted. | %devices.uptime < "300" && %macros.device = "1" | warning | Max: 1 Delay: 300 Interval: 300 |
| 12 | Poller is taking longer than expected. | %pollers.time_taken >= "250" | critical | Max: -1 Delay: 300 Interval: 300 |
| 13 | A network port has gone down. | %ports.ifOperStatus = "down" && %ports.ifOperStatus_prev = "up" && %macros.device_up = "1" | warning | Max: -1 Delay: 300 Interval: 300 |
| 14 | Interface errors rate is abnormally high. | %ports.ifOutErrors_rate >= "100" | critical | Max: -1 Delay: 300 Interval: 300 |
| 15 | Host has entered a Warning state. | %services.service_status = "1" | warning | Max: -1 Delay: 300 Interval: 300 |
| 16 | Host has entered a Critical state. | %services.service_status = "2" | critical | Max: -1 Delay: 300 Interval: 300 |
| 17 | FQDN does not include the domain name. | %devices.sysName !~ "@sol.milkyway" | warning | Max: -1 Delay: 300 Interval: 300 |
| 18 | Hostname includes the domain name. | %devices.hostname ~ "@.sol.milkyway" | warning | Max: -1 Delay: 300 Interval: 300 |
| 19 | IP Address is within the DHCP scope. | %devices.ip ~ "192.168.1.2@" | warning | Max: -1 Delay: 300 Interval: 300 |
| 20 | Host has not been polled within the last day. | %devices.last_polled >= "86400" | critical | Max: -1 Delay: 300 Interval: 300 |
| 21 | Host is using a slow network adapter. | %ports.port_descr_speed > "1000" | ok | Max: -1 Delay: 300 Interval: 300 |
| 22 | CPU ready time > 10% for 5 minutes. | %processes.cputime >= "10" | critical | Max: -1 Delay: 300 Interval: 900 |
| 23 | Host has less than 1GB of allocated memory. | %vminfo.vmwVmMemSize <= "1024" | warning | Max: -1 Delay: 300 Interval: 300 |
| 24 | Host has more than 3 VCPUs. | %vminfo.vmwVmCpus >= "3" | warning | Max: -1 Delay: 300 Interval: 300 |
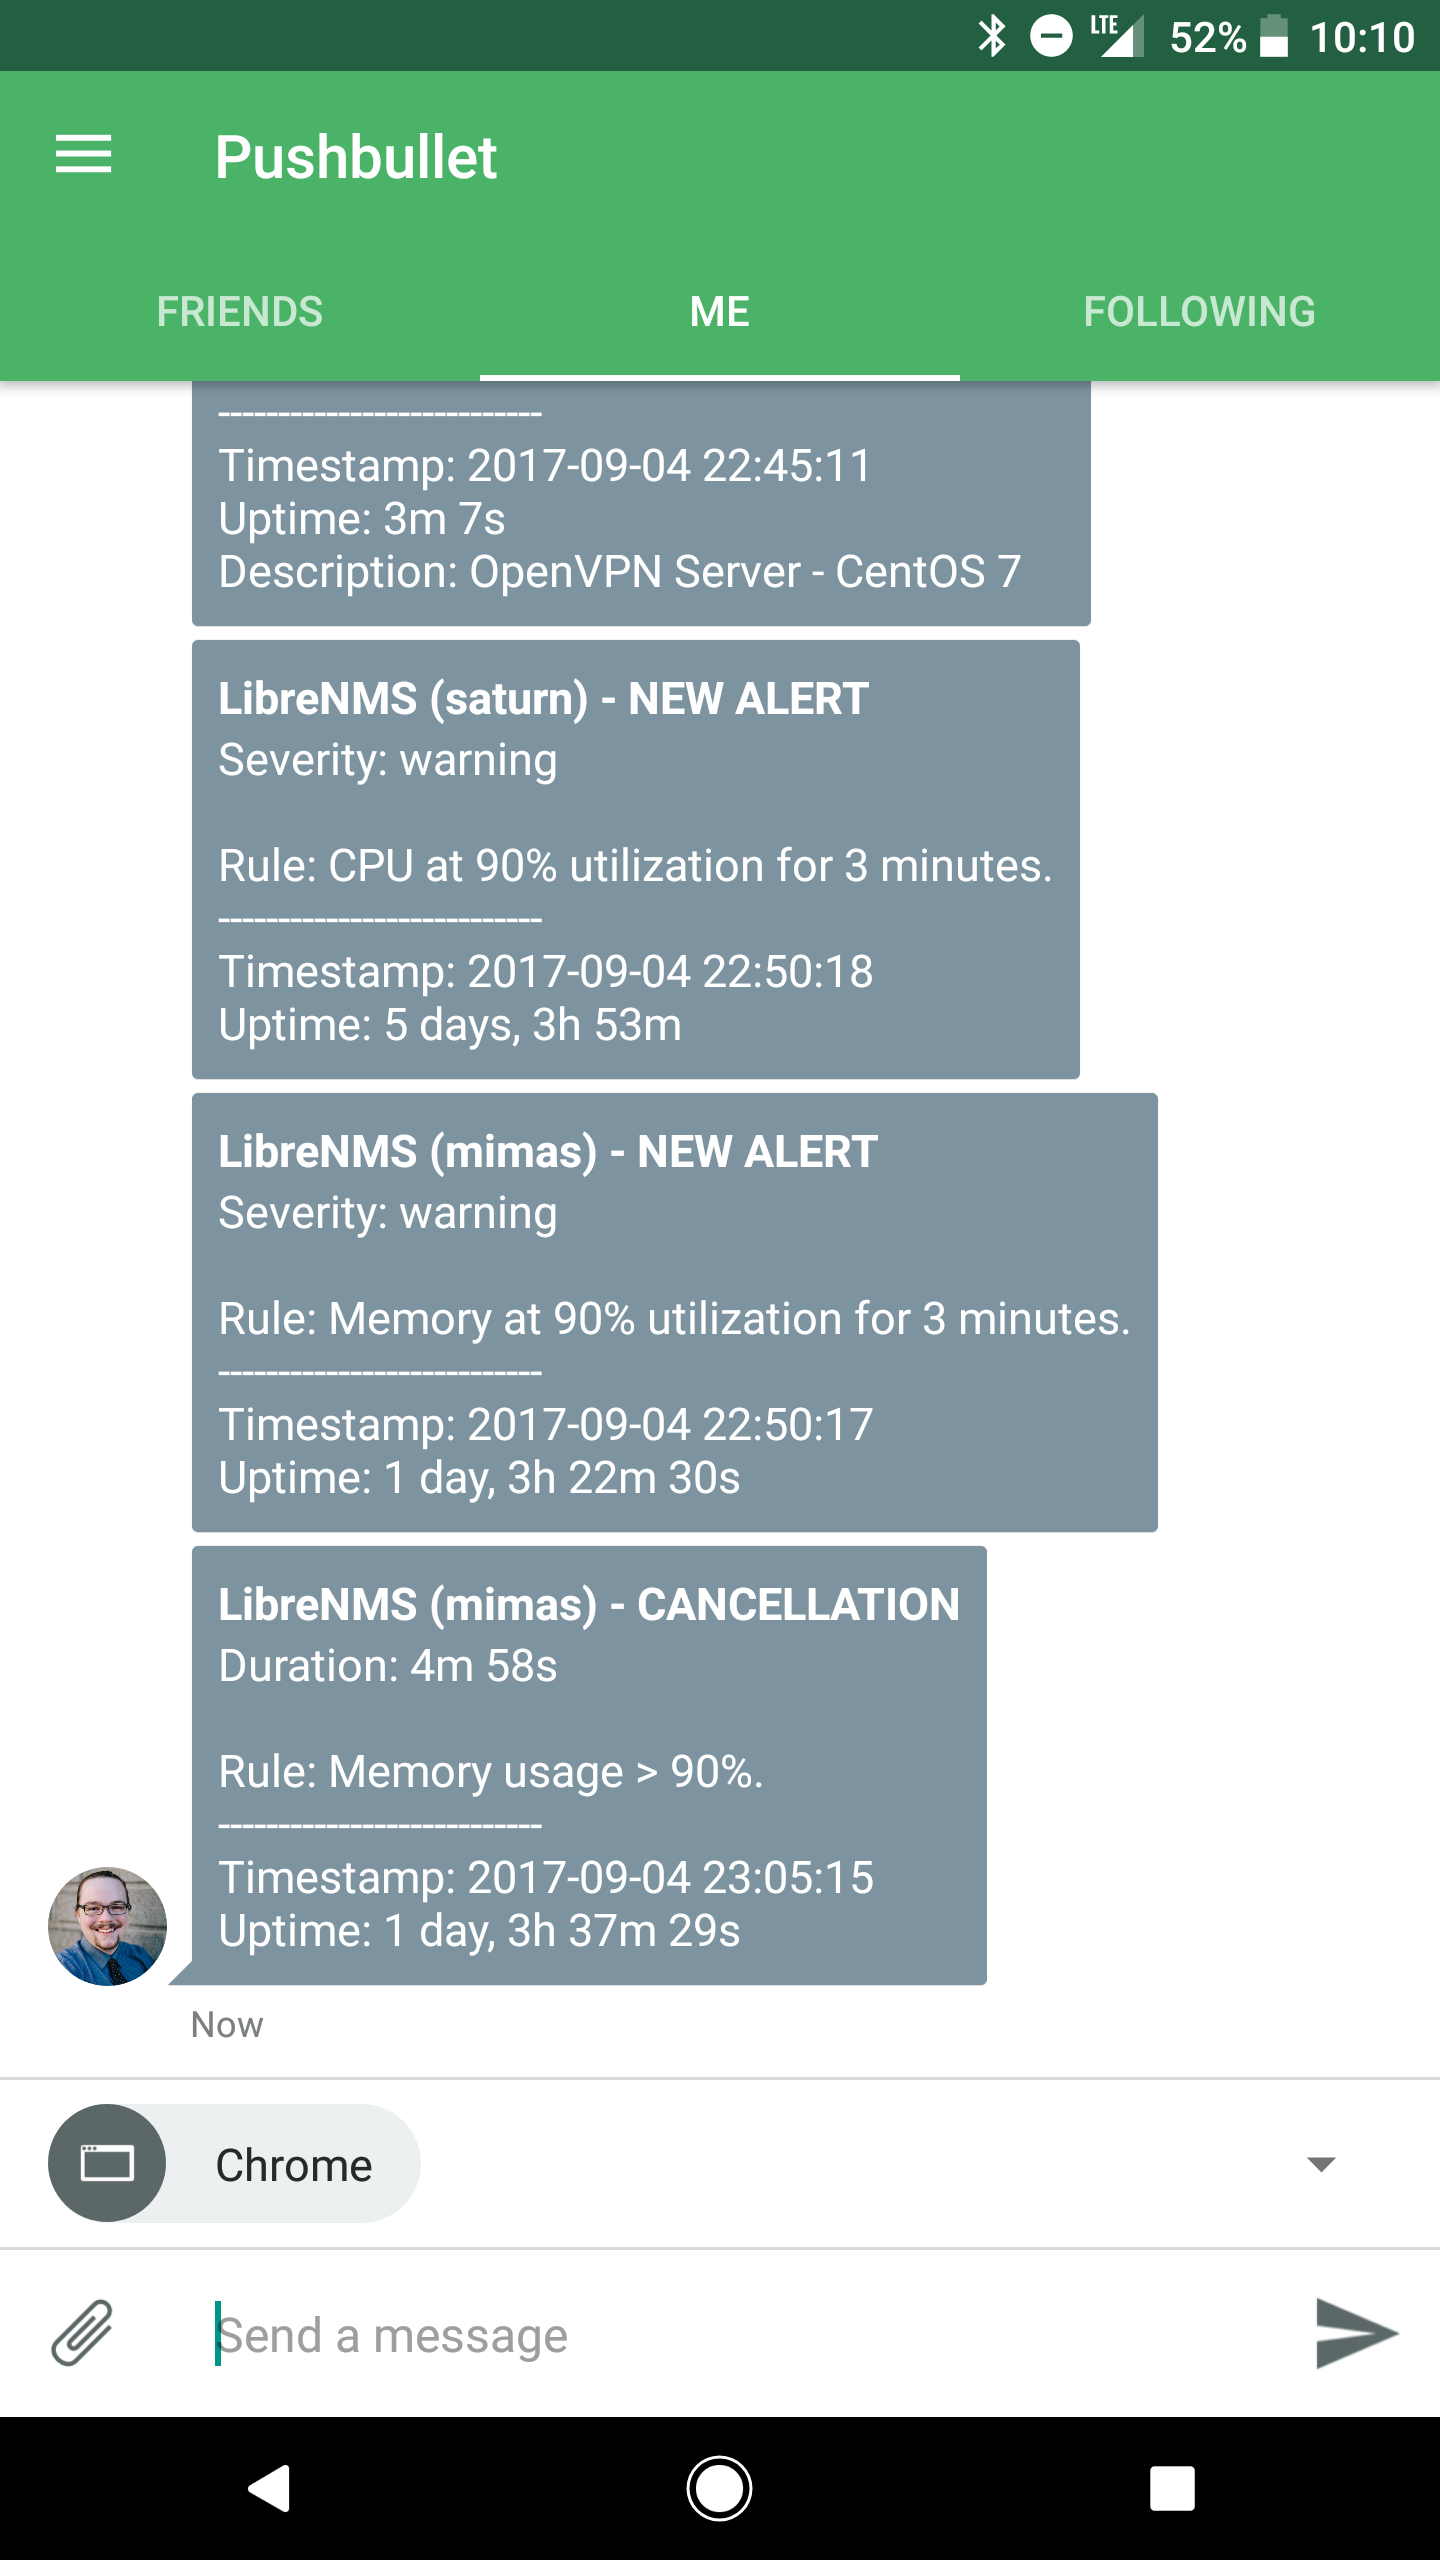
LibreNMS allows you to customize the alert message that is sent to your transport endpoint. The following is my default message. I did not bother with additional templates.
Alert Title: LibreNMS (%hostname) - NEW ALERT
Recovery Title: LibreNMS (%hostname) - CANCELLATION
Alert Body:
{if %state == 0}Duration: %elapsed{else}Severity: %severity{/if}

{if %name}%name{else}%rule{/if}
---------------------------
Timestamp: %timestamp
Uptime: %uptime_long
At this time several of the above rules are either not working or flawed. I have not done any troubleshooting, but simply disabled the rules in favor of resolving the issue at a later time.
 - Host has more than 3 VCPUs: This rule does not work effectively as it spams for physical devices > 3 CPU cores as well. (My hypervisor, workstation, & laptop)
 - Host has less than 1GB of allocated memory: This rule is ineffective as well as it mis-diagnoses physical devices. (Perhaps they return null for vminfo which triggers a false positive?)
 - FQDN does not include the domain name: For some reason this rule is also not functional. (Every device that is monitored returns a failure for this check during each interval cycle.)
 - Host has been down for 5 minutes: Times are not always accurate. Also delivers false positives for reboots occasionally. For example, rebooted my laptop (~45 seconds) and received an alert saying it had been down for 5 minutes.
The following is a screenshot of my phone displaying several push notifications using the above rules and templates in conjunction with Pusbullet as my transport endpoint.
