-
Notifications
You must be signed in to change notification settings - Fork 9
4. Widgets
All widgets have General tab and some of them have a separate tab
with settings specific to the widget
General Tab Fields:
-
Type- type of widget f.e AEM Bundle, AEM Healthcheck -
Title- any text -
Columns- set widget width in grid -
Rows- set widget height in grid -
Go to new line- check if widget should be displayed in new line -
Disabled- check if widget should have disabled state
*Expandable Content - option that allows you to display a large amount of content in the form of expandable content. Option is is not available for all widget. Take a look at screens below


-
Endpoint- choose AEM endpoint -
Schedule Period- time interval between executions >> recommended:300(5min) -
Error threshold for 'resolved' bundles- how many bundles with statusresolvedare needed to throw an error instead of warning -
Error threshold for 'installed' bundles- how many bundles with statusinstalledare needed to throw an error instead of warning -
Excluded bundles- list of bundles to be ignored when calculating widget status; can be either display name or symbolic name. Excluded bundles will be put in a separate section, with an option to view them all (including statuses).


-
Endpoint- choose AEM endpoint -
Schedule Period- time interval between executions >> recommended:300(5min) -
Health Checks- choose health checks which you would like to show*
* There are other health checks available in AEM. If other checks are desirable they can be added easily by contributing to:
cogboard-webapp/src/constants/index.js#AEM_HEALTH_CHECKS constant.


-
Endpoint- choose configured Bamboo endpoint -
Schedule Period- time interval between executions >> recommended:300(5min) -
ID- choose deployment which you would like to show
-
Go to
<bamboo_host>/deploy/viewAllDeploymentProjects.action -
Click on deployment from list
-
Project page opens:
- In URL you will find
IDnumber >> <bamboo_host>/deploy/viewEnvironment.action?id=1234567
- In URL you will find


-
Endpoint- choose configured Bamboo endpoint -
Schedule Period- time interval between executions >> recommended:300(5min) -
ID- choose plan you would like to show
- Go to
<bamboo_host>/allPlans.action - Click on plan from list
- Project page opens:
- In URL you will find
IDnumber >> <bamboo_host>/browse/CSOI-SDFAPTAS
- In URL you will find


Widget displays one of three status icons:
- success (green checkmark)
- failure (red cancel icon)
- indeterminate (indeterminate checkbox icon)
Users can toggle widget state by clicking its area.
State can also be updated by sending a POST request to content update endpoint: http://<board_host>/api/widget/contentUpdate for example using curl command in the CLI (first ensure that curl is installed on the machine):
curl -d '{"id": "widget17","content": {"widgetStatus": "CHECKBOX_OK"}}' -H "Content-Type: application/json" -X POST http://<board_host>/api/widget/contentUpdate
The JSON body of the request should follow the example structure:
{
  "id": "widget17",
  "content": {
    "widgetStatus": "CHECKBOX_FAIL"
  }
}
where:
-
id- the widget ID that can be copied from widget edit dialog.

-
widgetStatus- widget status to be set, possible vaues are:CHECKBOX_OK,CHECKBOX_FAIL,CHECKBOX_UNKNOWN
No additional configuration needed

-
URL- URL of a page that will be embedded as an iframe in a widget
example:https://www.youtube.com/embed/uBP9K2QJSSs


-
Endpoint- choose Jenkins endpoint* -
Schedule Period- time interval between executions | recommended:300(5min) -
Path- path to the job | example:/job/ProjectName/job/build-name
* example Jenkins Endpoint props:
  {
    id: "endpoint1",
    label: "Jenkins Endpoint",
    url: "http://internal.url or http://ip.address",
    publicUrl: "https://external.url",
    credentials: "credential2"
  }
Tested on Jenkins v.2.46.3

Widget displays the amount of Jira issues in user defined buckets. Buckets of issues can be added, deleted and edited.
-
Endpoint- choose Jira endpoint -
Schedule Period- time interval between executions | recommended:300(5min) -
Maximum number of issues- limit of the issues pulled from Jira in every bucket -
Bucket Name- name of the user defined bucket -
JQL Query- user defined query that matches the ticket requirements*
*JQL - Jira Query Language documentation

You can also use build-in jira search:

and copy the jql query parameter value from URL


Widget displays list of links specified be user. Items can be added, deleted and edited.
-
Link Title- any ext -
Link Url- url to external website

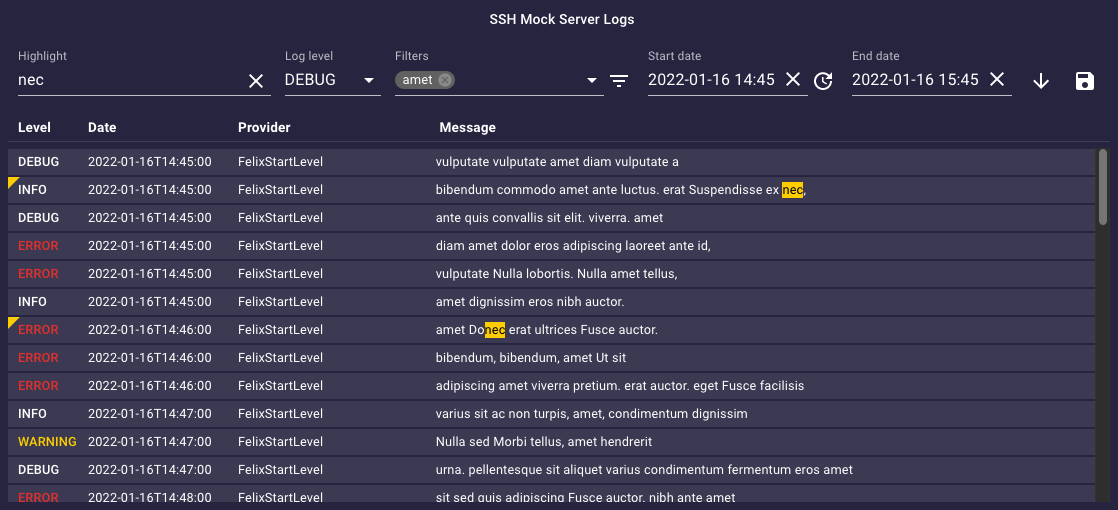
A widget for displaying and storing logs. It connects to a server via SSH and collects logs from a given file. You can then filter the logs by date, their level, as well as a set of rules defined by regular expressions.
-
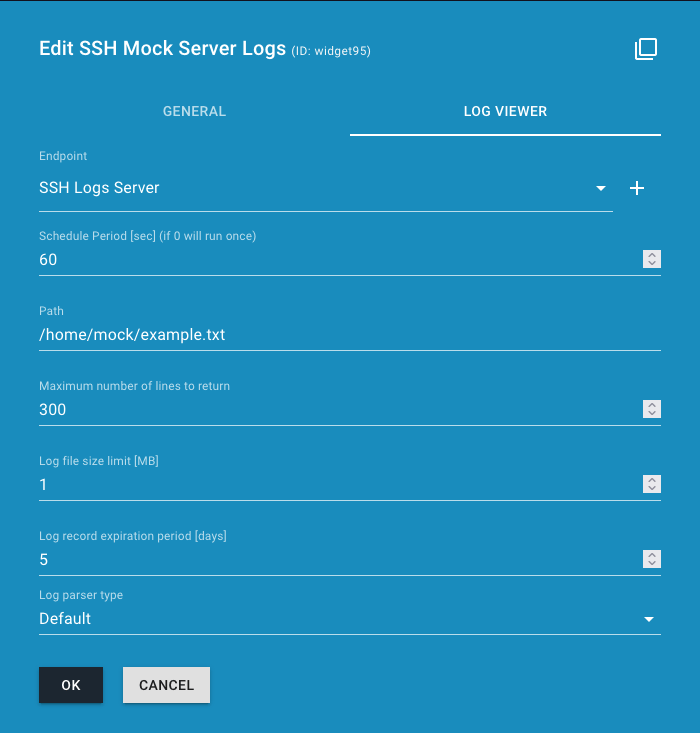
Endpoint- choose an endpoint from which you want to acquire the logs (requires an endpoint with an URL following the schemassh://host:portand appropriate credentials) -
Schedule Period- time interval between retrieving logs from the server -
Path- path to a file containing the logs -
Maximum number of lines to return- maximum number of lines that will be shown by the widget -
Log file size limit- maximum size of logs stored in the database for this widget (in MiB). When the size is exceeded, oldest logs are deleted from the database. -
Log record expiration period- number of days after which the logs are deleted from the database -
Log parser type- a parser to use when processing the logs.
Every application can output logs in different formats, with various information. A log parser is responsible for processing these logs from lines of text into a representation which the widget can interpret and show.
The default log parser is able to process logs in the format:
Date *Level* [Provider] Message
For example:
2000-12-31:23:59:59 *WARNING* [FelixStartLevel] Integer ipsum amet, vel tellus. vel
The connection between the backend container and the database can be configured in the cogboard-compose.yaml file.
The configurable environment variables in the backend container include:
-
MONGO_USERNAME(MONGO_INITDB_ROOT_USERNAMEin the mongo container,rootby default) -
MONGO_PASSWORD(MONGO_INITDB_ROOT_PASSWORDin the mongo container,rootby default) -
MONGO_HOST- the hostname (mongoby default) -
MONGO_PORT- the port (27017 by default)

Values written in the highlight field will be highlighted. Any logs matching the query will also receive a yellow check mark in their upper left corner. There is a 0.5 second delay after typing for the results to appear. You have to provide at least 3 characters.

Only logs matching all the filters will be displayed.
Level and Date fields are omitted.
Filters are saved in the browser's local storage.
It means that they are saved in the memory when you close the browser and you will see them back up when you open CogBoard again.
You can enable a filter by selecting it from the list which appears after clicking on the field.
To disable a filter, click on the X icon next to it.
You can open advanced options with plus button.
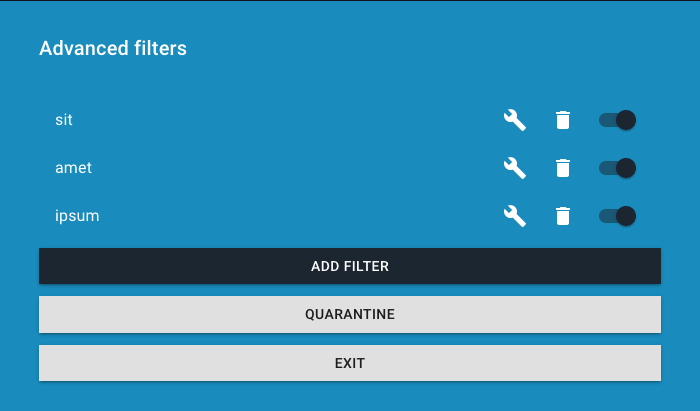
You can hover over a filter to view its regular expression.
To modify a filter, click on the wrench icon. To add a new filter, click on the Add filter button.
New filters are enabled by default. To disable a filter, click on the switch next to it.
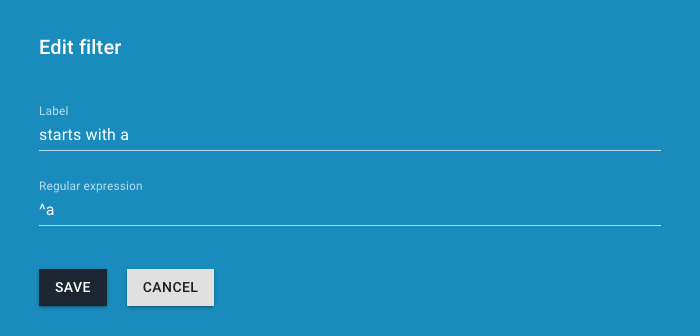
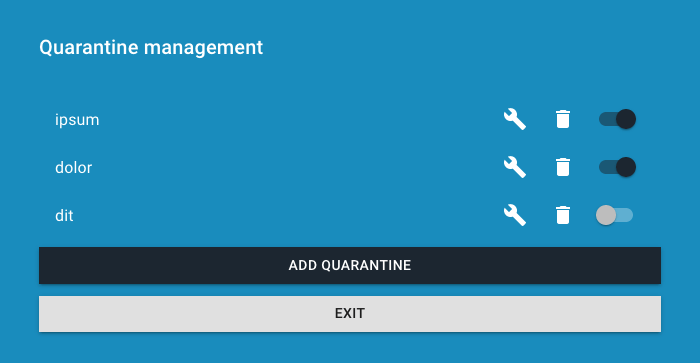
Quarantine is used to filter out logs for everyone and is stored on the server. Any incoming log matching a regular expression from any of the quarantine rules will be dropped and will not be saved in the database or shown to the user. Upon changing the rules, logs already stored in the database will be checked for matching any of the new rules (and deleted if they do).
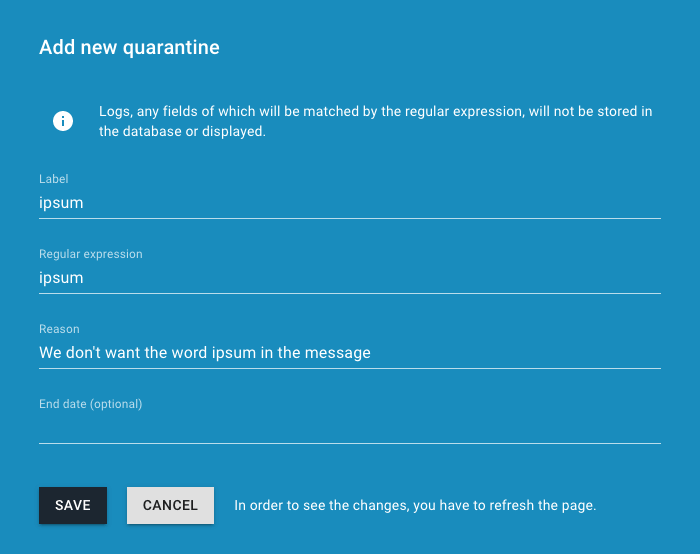
Adding a quarantine rule is largely similar to adding a filter. It has two additional fields:
- Reason - a reason for setting the rule
- End date - how long the rule should be enabled. When the end date passes, the rule is disabled. Enabling it back deletes the end time.
The rules in filters and quarantine are defined by regular expressions.
They are sequences of characters defining search patterns used to match character combinations in the contents of logs.
Simple patterns are constructed by characters for which you want to find a direct match.
For example, a pattern dolor will match all logs containing the word "dolor".
Some basic concepts:
- Or - Matches what's on the left or right side of it
-
gray|greycan match "gray" or "grey"
-
- Grouping - Parentheses define the scope and precedence of operators
-
gr(a|e)ycan match "gray" or "grey", the|means either the letter "a" or "e"
-
- Quantification - Specifies how often an element is allowed to occur
-
?- an element can occur zero or one time, e.g.colou?rwill match both "color" and "colour" -
*- an element can occur zero or more times, e.g.ab*cwill match "ac", "abc", "abbc", "abbbc" etc. -
+- an element can occur one or more times, e.g.ab+cwill match "abc", "abbc", "abbbc" etc. -
{n}- an element can occur n times, e.g.ab{3}cwill match "abbbc" -
{min,}- an element can occur at least min times, e.g.ab{2,}cwill match "abbc", "abbbc" etc. -
{,max}- an element can occur at most max times, e.g.ab{,3}cwill match "ac", "abc", "abbc", "abbbc" -
{min,max}- an element can occur at least min and at most max times, e.g.ab{2,3}cwill batch "abbc" and "abbbc"
-
- Wildcard -
.- matches any character, e.g.a.bwill match "aab", "a_b", "aab" etc.
More information about regular expressions can be found in the Wikipedia article and on the MDN website. You can try your regular expressions on many websites, such as regex101.com.

Logs are shown if their level is greater than or equal to the selected log level (the default level is info).
Selected log level is saved in browser's local storage.
It means that it is saved in the memory when you close the browser and you will see it back up when you open CogBoard again.
Defined levels:
debuginfowarningerror

Date span allows you to show logs only from a specific period of time. It is saved in browser's local storage. It means that is is saved in the memory when you close the browser and you will see it back up when you open CogBoard again.
The Show logs from now button sets the beginning of the date span to after the date of the last log.
This clears out all of the visible logs, resulting in an empty list (until new logs arrive).

New logs are always displayed at the end of the list, so if you want to see them,
you have to scroll to the end of it.
The Follow logs button allows you to automatically scroll to the end every time the widget is refreshed.
Upon scrolling, the functionality is disabled.
The Export to file button allows you to download all of the logs from the list.
You can customize which logs to download by settings filters, log level and date span.
The logs are saved in a JSON format.

Logs may contain additional information, which would not fit in one line. In order to show them, you have to expand a log by clicking on it. This action also reveals the following buttons:
-
Filter similar logs- opens the modal for adding a new filter. The regular expression field is filled with the contents of the header of the last field of the log. -
Add similar logs to quarantine(Admin only) - opens the modal for adding a new quarantine rule. The regular expression field is filled with the contents of the header of the last field of the log.

Widget cycle through defined text items in scheduled time intervals. Admin user can force item picking with a refresh button.
-
Randomize- By default widget cycle throw items in LIFO order, if this is enabled items are selected randomly -
Daily- If enabled next value will be selected in next day - minute after midnight -
Interval- Interval between cycling items in minutes -
Entries- List of values to be showed


-
Schedule Period- time interval between executions >> recommended:300(5min) -
Request Method- choose request method >>GET | PUT | POST | DELETE -
Content Type- choose header content type >>application/json | application/xml | multipart/form-data | text/html | text/plain -
Endpoint- choose service endpoint -
Path- service url >> example:/login -
Response Body Fragment- response body fragment that is expected for this service -
Expected Status Code- status code that is expected for this service >> default:200

Widget displays:
- Expected status code. If the response status code is different it shows ex. "200 EXPECTED, GOT 404"
- Response status:
-
MATCH- response includes expected response fragment -
NOT MATCH- response not includes expected response fragment -
OK- when expected response body remains empty
-
- Response body message - in a popover after hovering a mouse over response status


-
SonarQube Version- 7.x, 6.x or 5.x supported -
Endpoint- choose Jenkins endpoint* -
Schedule Period- time interval between executions | recommended:300(5min) -
Key- project key | example:com.cognifide.zg:com.cognifide.zg:stable -
Metrics- choose metrics which you would like to show
- Go to
<sonarqube_host>/dashboard/index - Click on project from list
- Project page opens:
- In URL you will find
IDnumber | <sonarqube_host>/overview?id=316488 - On a page (upper-right corner) you will find
Key
- In URL you will find
* example SonarQube Endpoint props:
  {
    id: "endpoint2",
    label: "SonarQube Endpoint",
    url: "http://internal.url or http://ip.address",
    publicUrl: "https://external.url",
    user: "user.name",
    password: "pass",
    token: "token"
}- user should fill one of two login options:
passwordortokenfield


-
Text- any text (multiple lines allowed) -
Text Size- text sizes fromXXStoXXL>> default:M -
Vertical Text- rotate text by 90 degrees >> default:false


Widget displays list of items specified be user. Items can be added, deleted and edited. You can check the done items.
-
Item Title- any text (multiple lines allowed)

It creates a blank space between widgets.
No additional configuration needed. This widget is invisible when the user logged out.

Widget displays current time and date of the specific timezone
-
Timezone- choose GMT timezone -
Date Format- choose date display format -
Time Format- choose between 12 or 24 hour time format -
Display date- check if date should be displayed -
Display time- check if time should be displayed -
Text Size- choose size of date and time


Widget is able to show information about: cpu, ram, heap, disk, logged users, uptime and number of processes.
It is mandatory to fill all the fields with proper content to have properly working widget.
-
Endpoint- choose Zabbix endpoint -> endpoint URL and Public URL must have/zabbix/api_jsonrpc.phpon the end -
Schedule Period- time interval between executions -
Host- provide host name, host name shouldn't be taken from group level. Choose lower level host name - e.g.pre-cog-front-publisher01.dll.dlgpl.net -
Metric- choose which metric should be displayed:- Active users
- Available Memory
- CPU Utilization
- Mem heap size
- Number of processes
- System uptime
- Used disk space
- Used swap space
Next two configuration fields are available only if specific metric will be selected e.g. available memory, disk space etc. This is due to the fact that in some cases the progress bar will be displayed. So we need to specify range and maximum value, which will be used to calculate the percentage value.
-
Max Value- provide max value for metric (in GB) -
Range- define the range where the widget will display ok, warning or error status based on the percentage value
