-
Notifications
You must be signed in to change notification settings - Fork 124
PulsarIO Demo
PulsarIODemo gives an example of the visualization solution for data analyzing.
Please set up your pipeline following Get-Started
There is an emulator which emulate user click event and send to the pipeline collector, the collector will do geo and device enrichment, then flow to sessionizer and do the sessionization, distributor, metrics calculator do the metrics aggregation on various dimensions and store it on metrics store and also push the metrics via web socket.

Control the simulator
The simultor is embedded on the collecotor, it can be controlled via below url:
- Pause traffic: http://HOST:port/Event/Processor/EventGenerator/?pause
- Start traffic: http://HOST:port/Event/Processor/EventGenerator/?start
It receive twitter sample feed and convert it to the Jetstream Event and flow it in to the distributor, then do aggregation on the hashtag and country in the metrics calculator. It require twitter OAUTH token to run the twitter sample app.

Dashboard url: http://:8088
-
Realtime tab
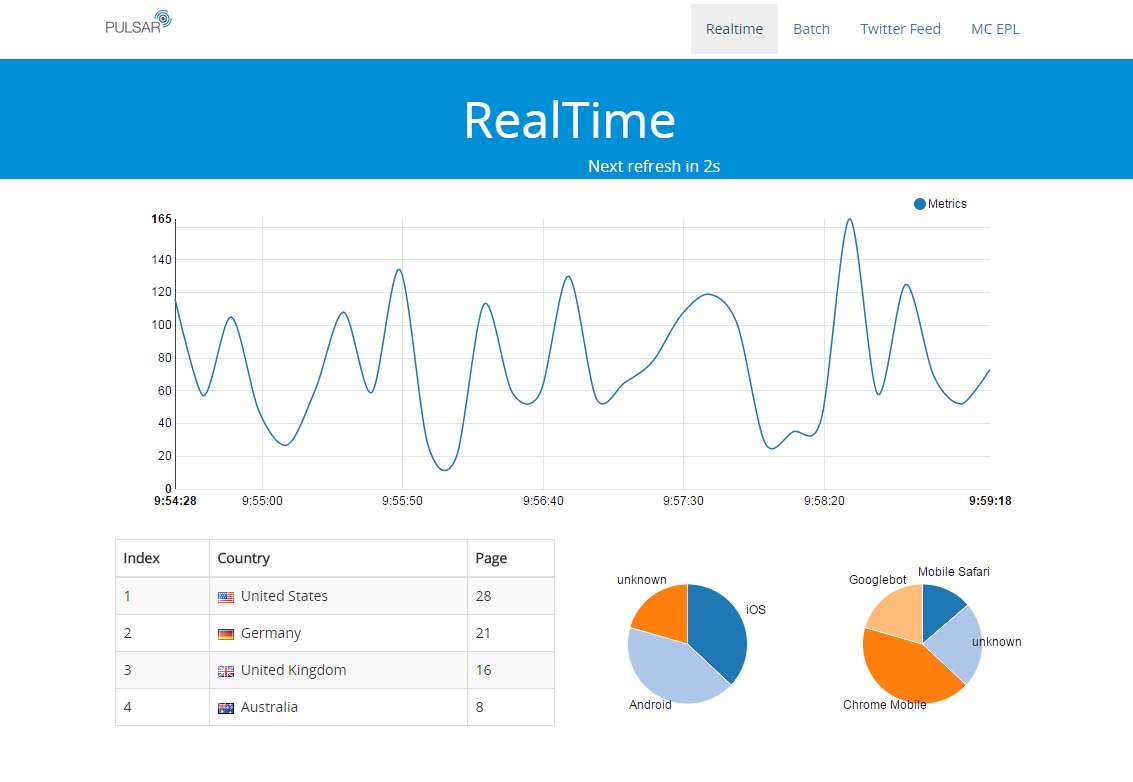
In this tab, you will see the past 5 minutes event aggregation count trend and break down list chat and pie chat based on country/browser/OS dimension in real-time mode (10s refresh).
Demo data is coming from Collector EventGenerator processor and going through collector->sessionization->distributor->MetricCalculator.
MetricCalculator does the run-time aggregation on several metrics with 10s interval and broadcast the metric data to MertricUI through Jetstream message. And then MertricUI aggregates on the metrics in its Esper again in 10s interval then broadcast the metrics to browser via websocket channel.
MetricCalculator EPL
MetricUI EPL -
Batch tab
In this tab, you will see the past 24 hours event aggregation count trend and break down list chat and pie chat based on country/browser/OS dimension. Click the country link, it will lead you to the drill down page.
Demo data is coming from Collector EventGenerator processor and going through collector->sessionization->distributor->MetricCalculator.
MetricCalculator does the run-time aggregation on several metrics within a longer window(5 min), aggregation result are stored to a metric store and it's Cassandra. MertricUI pulls the metrics from Cassandra through MetricService to draw the graph.
MetricCalculator EPL -
Twitter Feed tab
In this tab, you will see the past 5 minutes event aggregation count trend and break down list chat and pie chat based on country/language/Hashtag dimension in real-time mode (10s refresh).
Demo data is coming from twitterSample application and push to MetricCalculator directly. MetricCalculator does the run-time aggregation on several metrics with 10s interval and broadcast the metric data to MertricUI through Jetstream message. And then MertricUI aggregates on the metrics in its Esper again in 10s interval then broadcast the metrics to browser via websocket channel.
MetricCalculator EPL
MetricUI EPL
- Web Site: http://gopulsar.io
- Google Group: Pulsar Google Group
- Developer Mail: [email protected]
- White Paper: Pulsar White Paper