Bioconductor build status:
The
pRolocGUI
package is an interactive interface to explore and visualise
experimental mass spectrometry-based spatial proteomics data. It
relies on the shiny framework for
interactive visualisation, the
MSnbase
package to handle data and metadata and the
pRoloc
software for spatial proteomics specific data matters. Example spatial
data is available in the
pRolocdata
experiment package.
The pRoloc suite set of software are distributed as part of the
R/Bioconductor project and are developed
by Lisa Breckels at the Cambridge Centre for Proteomics
at the University of Cambridge and by Laurent Gatto,
director of the Computational Biology and Bioinformatics (CBIO) group
at UCLouvain, in Belgium.
This document describes the installation of the software, followed by
a basic quick start guide for using pRolocGUI to search and
visualise spatial proteomics data. Please refer to the respective
documentation and vignettes for full details about the software.
If you use these open-source software for your research, please cite:
Gatto L, Breckels LM, Wieczorek S, Burger T, Lilley KS. Mass-spectrometry-based spatial proteomics data analysis using pRoloc and pRolocdata. Bioinformatics. 2014 May 1;30(9):1322-4. doi:10.1093/bioinformatics/btu013. Epub 2014 Jan 11. PMID:24413670; PMCID:PMC3998135.
Breckels LM, Gatto L, Christoforou A, Groen AJ, Lilley KS, Trotter MW. The effect of organelle discovery upon sub-cellular protein localisation. J Proteomics. 2013 Mar 21. doi:pii: S1874-3919(13)00094-8. 10.1016/j.jprot.2013.02.019. PMID:23523639.
Gatto L., Breckels L.M., Burger T, Nightingale D.J.H., Groen A.J., Campbell C., Mulvey C.M., Christoforou A., Ferro M., Lilley K.S. 'A foundation for reliable spatial proteomics data analysis' Mol Cell Proteomics. 2014 May 20.
pRolocGUI is written in the R
programming language. Before installing the software you need to
download R and (optionally) RStudio.
-
Download the latest
Rrelease for your operating system from the R website and install it. -
Optional, but recommended. Download and install the RStudio IDE.
RStudioprovides a good code editor and excellent integration with theRterminal. -
Start
RorRStudio. -
Install the Bioconductor packages
pRoloc,pRolocdataandpRolocGUI:
pRolocGUI requires R >= 3.1.1 and Bioconductor version >= 3.0.
In an R console, type
if (!requireNamespace("BiocManager", quietly=TRUE))
	install.packages("BiocManager")
BiocManager::install(c("pRoloc", "pRolocdata", "pRolocGUI"))
The development code on github can also be installed using
BiocManager::install (or install_github). New pre-release features
might not be documented or thoroughly tested and could substantially
change prior to release. Use at your own risks.
BiocManager::install("ComputationalProteomicsUnit/pRolocGUI")
Before using a package's functionality, it needs to be loaded:
library("pRolocGUI")
We first load data from
Christoforou et al 2016
distributed in the pRolocdata package:
library("pRolocdata")
data(hyperLOPIT2015)
There are 3 different visualisation applications currently
available: explore, compare and aggregate.
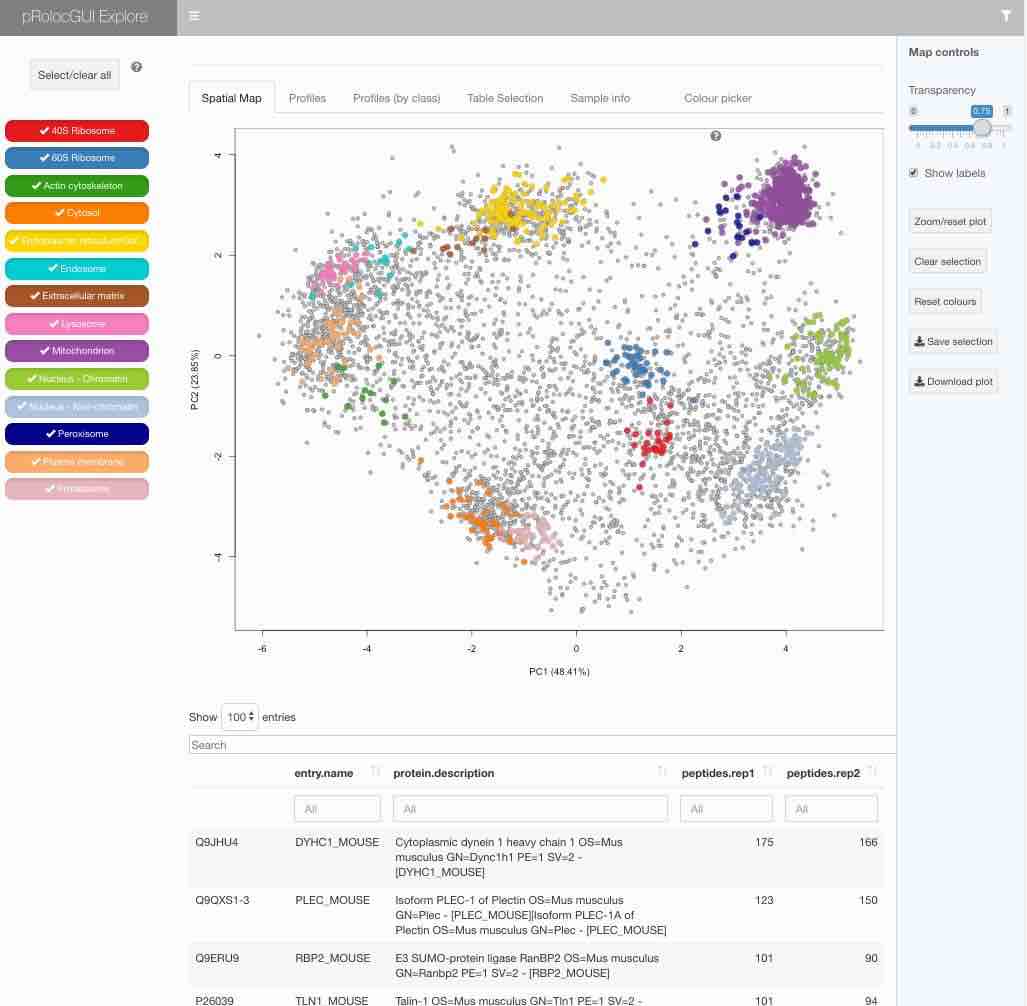
These apps are launched using the pRolocVis function and
passing object, which is an MSnSet containing the data
one wishes to interrogate. One may also specify which app
they wish to use by using the app argument, see ?pRolocVis
for more details. The default app that is loaded if
app is not specified is the explore application:
pRolocVis(hyperLOPIT2015)
The graphical interface is described in details in the package
vignette that is included in the package itself (get it by typing
vignette("pRolocGUI") in R), available by clicking the ? once
the interface is loaded or can be
consulted online.
- The Bioconductor support forum
- Open a
pRolocGUIGitHub issue (requires a free GitHub account).
- An introduction to Bioconductor
- A brief introduction to
pRolocGUI - Downloading and install
R - Using RStudio
- Installing the
pRolocGUIinterface - Starting
pRolocGUI- This tutorial is for the older legacy applications. New videos will appear shortly for the new applications. - Using
pRolocGUIto explore and visualise experimental spatial proteomics data - This tutorial is for the older legacy applications. New videos will appear shortly for the new applications.
Tutorial playlist.
- Teaching material
- R and Bioconductor for proteomics web page and package.

