-
Notifications
You must be signed in to change notification settings - Fork 5
Syntax: Dataflow
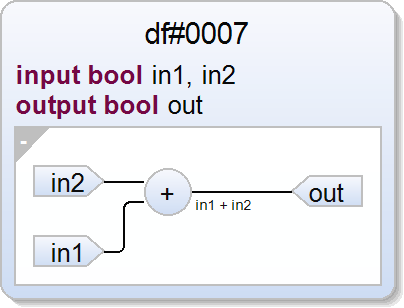
You can convert a region into a dataflow region by replacing the region keyword with the keyword dataflow. Within a dataflow scope, you can simply write down your equations.
Below you see several examples and their synthesized diagrams.
You can use all expressions in the kexpressions language. This includes standard operations such as arithmetics and binary/logical logic. A full set of operations can be found at the end of this page (in the future).
scchart df#0007 {
  input bool in1, in2
  output bool out

  dataflow:
  out = in1 + in2
}

Just as before, you can declare references to other SCCharts. As before, use the ref keyword in your declaration section. Each variable represents an instance. Inputs and outputs are separated by a dot (.). Same wires are merged automatically in the diagram.
import "DF-0002"

scchart df#0461 {
  output int O, O2, O3, O4
  ref df#0002 A, A2, A3, A4

  dataflow:
  O = A.O || A2.O || A3.O
  O2 = A.O || A2.O || A3.O
  O3 = A.O || A2.O || A3.O
  O4 = A.O || A2.O || A3.O
}

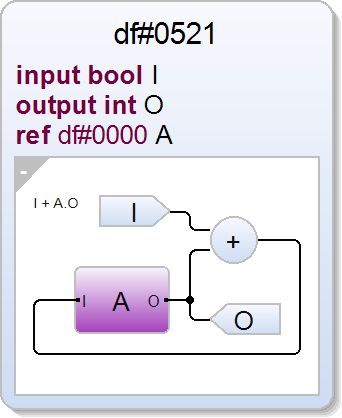
Of course you can model loops in your wiring. However, depending on the consecutive compilation/scheduling the program may or may not be executable/schedulable.
import "DF-0000"

scchart df#0521 {
  input bool I
  output int O
  ref df#0000 A

  dataflow:
  A.I = I + A.O
  O = A.O
}

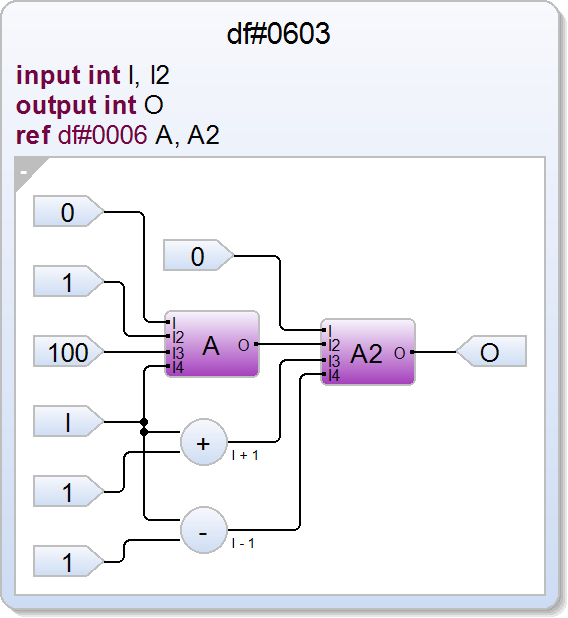
You can use the aforementioned tuple syntax to assign all/some inputs at once. Hence, it is possible to construct complex models with only a few lines of code.
import "DF-0006"

scchart df#0603 {
  input int I, I2
  output int O
  ref df#0006 A, A2

  dataflow:
  A = {0, 1, _, I}
  A2 = {0, A.O, I + 1, I - 1}
  A.I3 = 100
  O = A2.O
}

You can use customized skins instead of the standard referenced SCCharts
actor diagram. Since we are using KLighD, you have to specify your actor
in KLighD's Graph Syntax (.kgt). Once you have created a custom .kgt,
you can add it to an SCChart with the @figure annotation. The
annotation combined with a skinpath relative to the calling model points
to the target .kgt.
import "DF-0007"
#skinpath "skin"

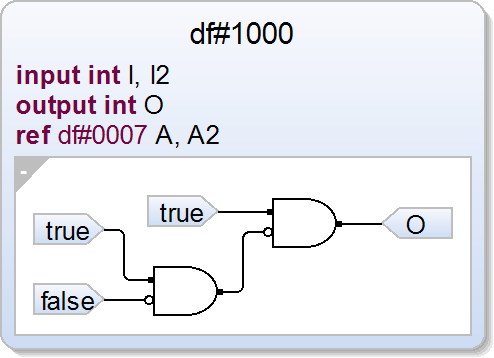
scchart df#1000 {
  input int I, I2
  output int O
  ref df#0007 A, A2

  dataflow:
  A = {true, false}
  A2 = {true, A.out}
  O = A2.out
}

For example: Imaging df#0007 is annotated
with @figure "and2AN.kgt".
Now df#1000 can set a skinpath pragma. Together they point to the .kgt that should be used as actor diagram. In this case, we get an and with a negated input.
Even if df#0007 was not annotated, you can archive the same result if
you annotate the ref declaration in df#1000.:
@figure "and2AN.kgt" ref df#0008 A, A2
KIELER is an open source software project by the RTSYS Group at Kiel University, licensed under the Eclipse Public License or Eclipse Public License 2.0 | KIELER Mailing List
- Basic Syntax
- Annotations and Pragmas
- Dataflow
- Hostcode
- Timed Automata
- Object Orientation
- LEGO Mindstorms
- Developer Eclipse Setup with Oomph
- Semantics Release Process
- Build KIELER without Eclipse
- Automated Tests and Benchmarks
- Simulation Visualization (KViz)
- Legacy .sct Models
- Simulation Visualization (KViz)
- KiCo Tutorial