English | 简体中文 | 繁體中文 | 日本語 | Deutsch
Transform your Obsidian experience with the Color Table Plugin—your go-to tool for turning raw data into beautifully formatted tables and engaging charts without the need to master complex Markdown table syntax.
Listen to AI audio review to learn more about the exciting features of the Color Table plugin:
- 🎨 Beautify Your Tables: Quickly turn raw data into polished, easy-to-read tables.
- 🌈 Customize with Color: Express your style with a range of vibrant color themes for your tables.
- 📊 Visualize Trends: Effortlessly convert your data into eye-catching bar charts or other chart types such as pie, line, and radar charts for quick insights.
- ✨ Interactive Features: Zoom and pan on charts, hover over data points for detailed information, and enjoy interactive table sorting to gain deeper insights from your data.
- Open Obsidian and navigate to Settings.
- Head over to the Community Plugins section.
- Deactivate Safe Mode.
- Click Browse, then search for Color Table.
- Install and activate your table and chart companion!
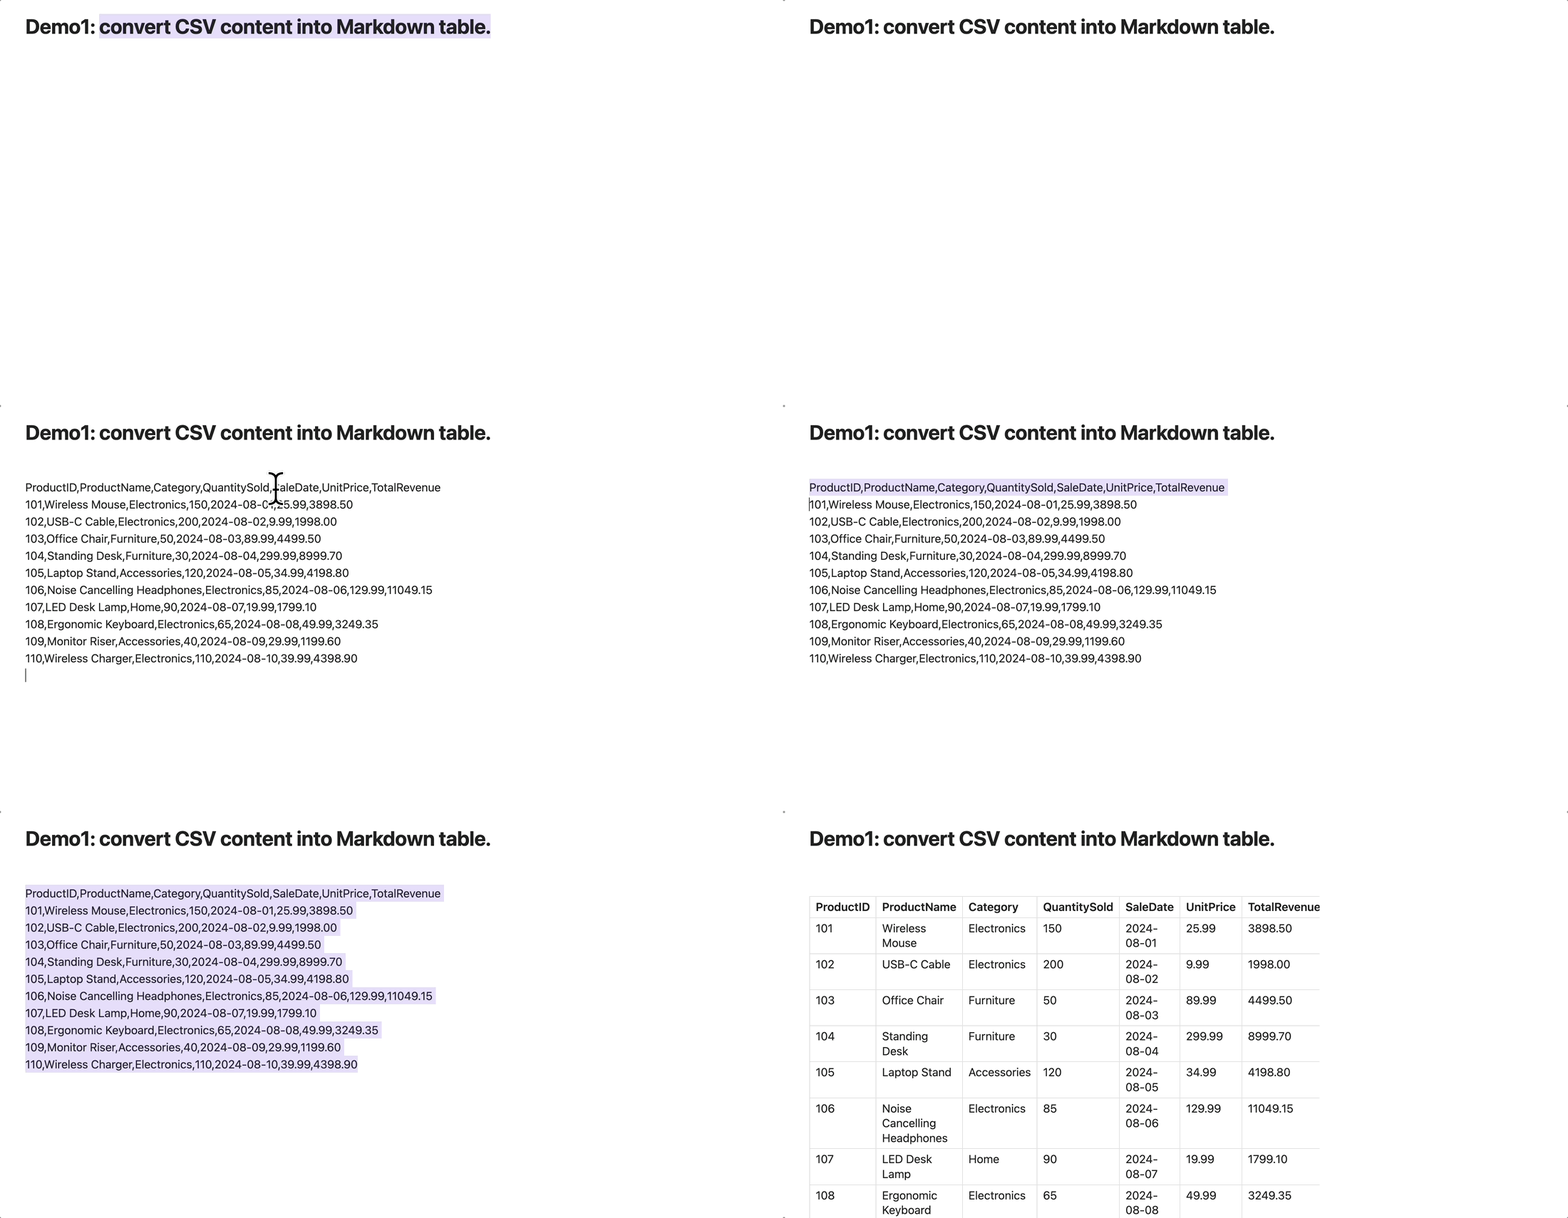
Select any plain-text data in your Markdown file and use the "Convert to Markdown Table" command. The plugin will automatically transform your data into a clean, organized table—no need to worry about complex formatting. If the data format is incorrect, a helpful notification will appear.
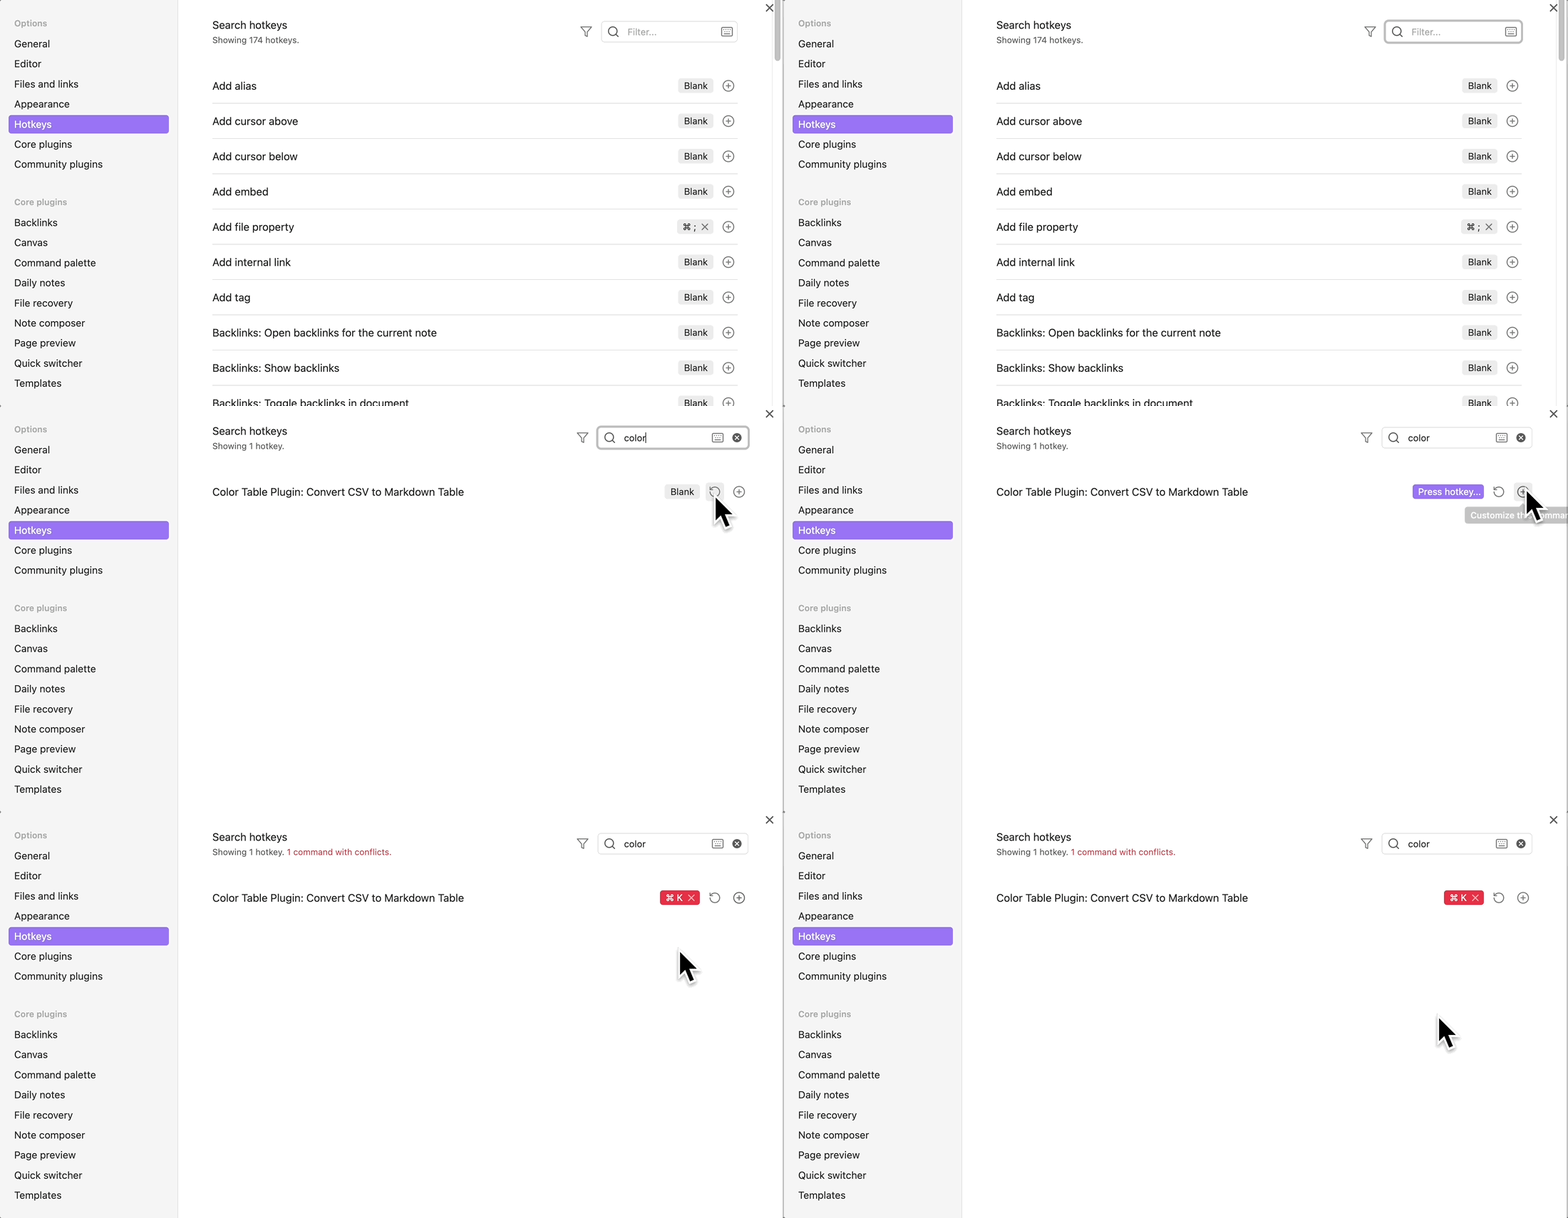
Tip: Use hotkeys to speed up the conversion process! Be sure to separate your data values with commas (,) for the best results.
In your Markdown file, use the following format to generate visually appealing tables:
```csv-table orange
ID, Name, Age, Department, Salary
1, Alice, 29, HR, 50000
2, Bob, 35, IT, 75000
...
12, Liam, 45, Finance, 82000
```Enhance your tables with dynamic features like sortable columns, allowing you to:
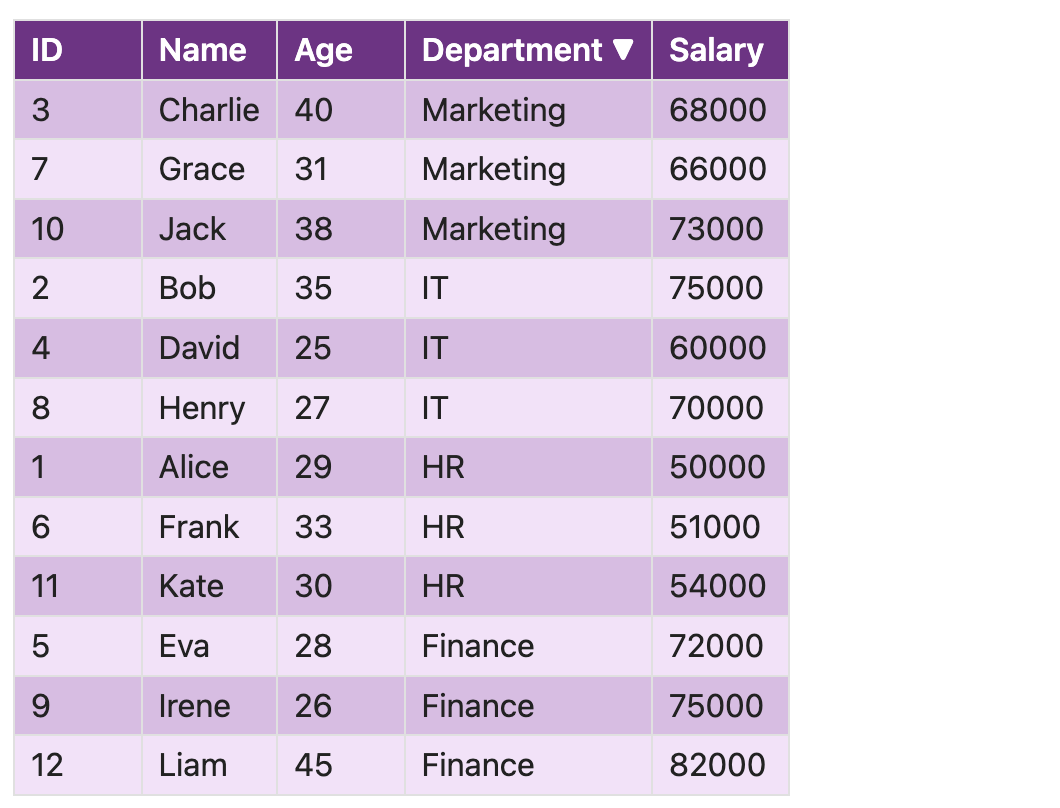
- 🖱️ Instant Sorting: Click any column header to sort your data.
- 🔄 Toggle Sorting Direction: Easily switch between ascending and descending order.
- ⚡ Real-Time Updates: Watch your data re-sort instantly, helping you make quick decisions.
Want to visualize your data with a bar chart, pie chart, line chart, or radar chart? It's simple! Use this format to instantly convert your table into a chart:
```csv-chart red bar
Month, Sales
Jan, 1200
Feb, 200
...
Dec, 1900
```

```csv-chart blue pie
Category, Percentage
A, 30
B, 25
C, 45
```

```csv-chart green line
Date, Revenue
2021-01-01, 500
2021-02-01, 750
2021-03-01, 900
```- 🔍 Zoom and Pan: Explore your data by zooming in on specific areas or panning through large datasets.
- 🎯 Hover Details: Get detailed information about each data point by hovering over it on the chart.
Personalize your tables and charts with a variety of color themes to match your Obsidian aesthetic:
- orange
- blue
- green
- red
- purple
- gray
- pink
- yellow


