A munin plugin for UniFi gear - All written in 100% perl
- standard pre-requisites, no 3rd party API client.
- does not yet support WebRTC requests - needs direct access to the controller.
- requires multigraph support
- supports munin-dirtyconfig (see performance below.)
All graphs are created by default, see below on how to toggle sections of this plugin off. The following are the graphs provided:
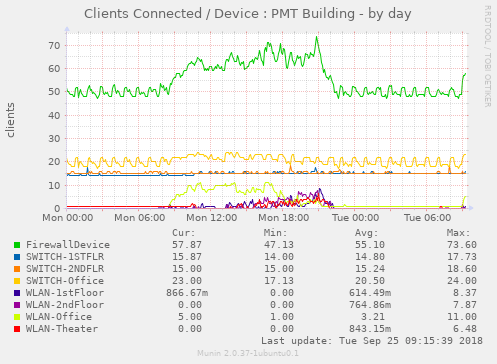
Display a count of clients connected per unifi device (physical device)
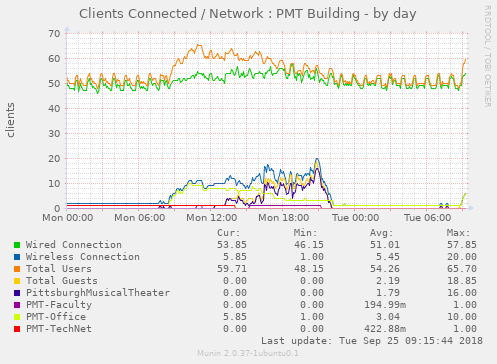
Display a count of clients grouped by how they are connected (wired/wireless, user/guest, SSID)
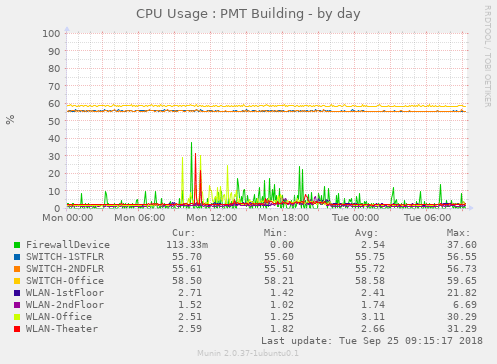
Display CPU usage on each unifi device
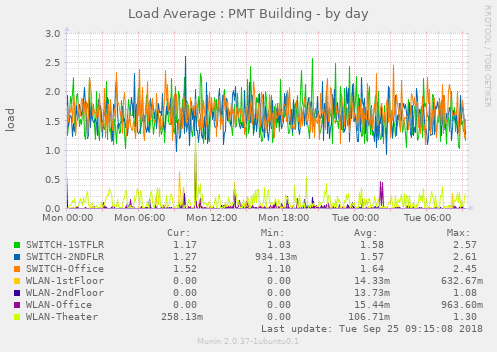
Display the load average on each unifi device
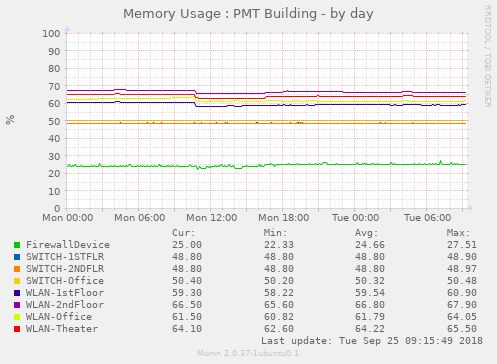
Display the memory usage on each unifi device
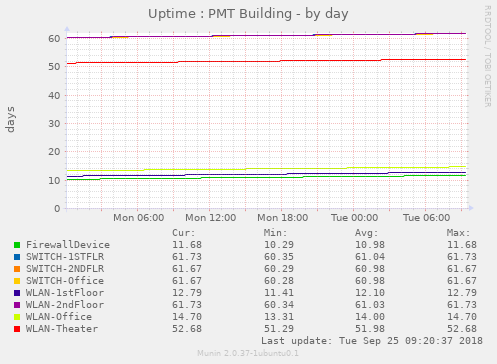
Display the uptime of each unifi device, in days
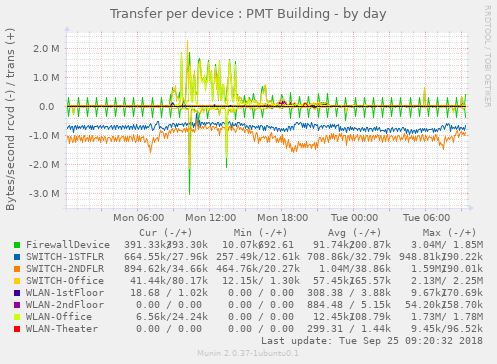
Display transfer statistics on a per unifi device basis
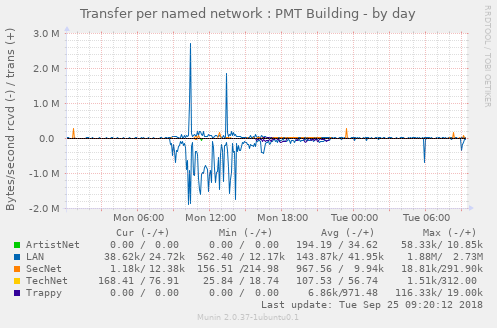
Display transfer statistics per named network (VLAN, LAN, etc) (Requires a USG) - if you have more than one firewall device on a "site", this plugin will almost certainly shit the bed. I don't know if this is a use case that can/should exist, but I didn't plan for it.
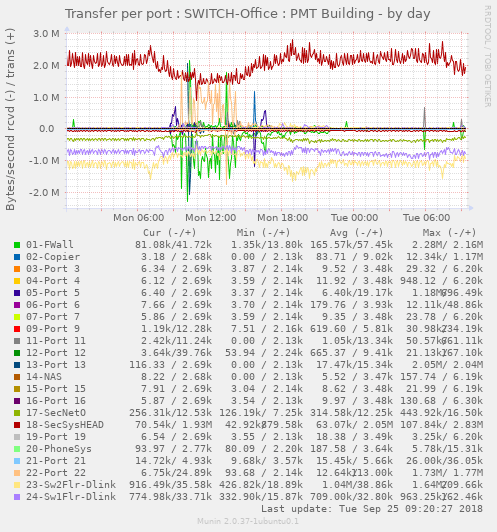
Display transfer statistics per physical network port (Switches only)
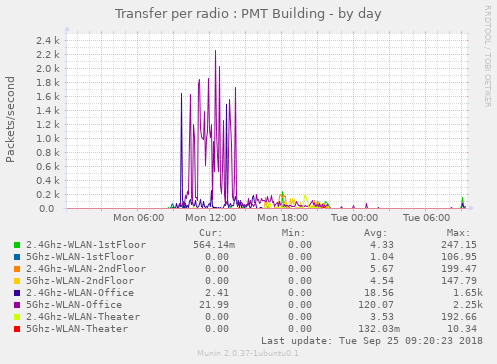
Display transfer statistics per physical radio (APs only)
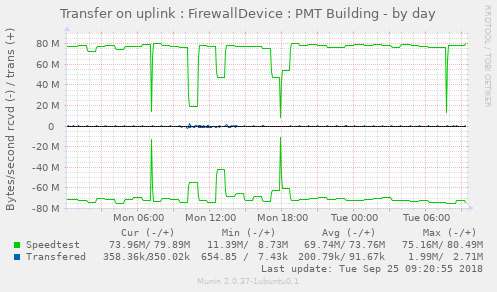
Displays transfer statistics for your network uplink (This is not robust - I have a single UFW, and it does not have a wan failover port - at a minimum, I'd need dumps from the /stat/device API point for a bunch of configurations to make this not choke if your configuration doesn't match mine. If you do feel the need to send, there probably is sanitzation to be done in there.) (Also, should the plugin run while speedtest is running, it'll report zero - by default, munin runs every 5 min, on :00, :05, etc - plan accordingly)
This script uses the multigraph functionality to generate many graphs. As such, there are a significant amount of available configuration options
You will need to supply your API login details:
  [unifi_api]
    # User name to login to unifi controller API.  Default is "ubnt".  Ideally, this should
    # point to a read-only account.
    env.user Controller_Username

    # Password to login to unifi controller API. Default is "ubnt"
    env.pass Controller_Password

    # URL of the API, with port if needed.  No trailing slash.
    # Default is https://localhost:8443
    env.api_url https://unifi.fqdn.com:8443

    # Verify SSL certificate name against host.
    # Note: if using a default cloudkey certificate, this will fail unless you manually add it
    # to the local keystore.
    # Default is "yes"
    env.ssl_verify_host no

    # Verify Peer's SSL vertiicate.
    # Note: if using a default cloudkey certificate, this will fail
    # Default is "yes"
    env.ssl_verify_peer no

    # The human readable name of the unifi site - used for graph titles
    env.name Site Name

    # "Site" string - the internal unifi API site identifier.
    # default is "default" - found when you connect to the web interface
    # it's the term in the URL - /manage/site/site_string/dashboard
env.site site_string Sometimes, you need more control over where the unifi graphs appear.
    env.force_category 0
    # By default, Use standard munin well know categories -
    #  system: cpu, mem, load, & uptime
    #  network: clients, transfer statistics.
    #
To use this feature, set "force_category" to a text string (i.e. "unifi").
This is very helpful if your graphs are going to appear inside another host - for instance if your munin graphs for that host are monitoring the host the controller is running on, and the unifi API instance.
Sometimes however, you want to monitor either an offsite API, or a cloudkey which, at least by default, does not run munin-node. In that case, you can actually create a "virtual" munin host to display only these graphs (or any combination you like). This is documented in the main munin docs, but in a nutshell:
In your munin-node plugin configuration: (Something like: /etc/munin/plugin-conf.d/munin-node)
  [unifi_api]
    host_name hostname.whatever.youlike
    env.force_category unifi
And, in your munin master configuration: (Something like: /etc/munin/munin.conf)
  [hostname.whatever.youlike]
    address ip.of.munin.node
Make sure you do not set "use_node_name" on this new host. It may be nessesary to define "host_name" in your munin-node configuration as well, if you have not already (Likely, on a multi-homed host, this has been done to keep munin-node from advertising itself as localhost)
More information:
You can turn off individual graphs. A few graphs have extra configuration options.
By default, everything is enabled. Set to "no" to disable
  [unifi_api]
    # Show device CPU utilization
    env.enable_device_cpu yes

    # Show device memory usage
    env.enable_device_mem yes

    # Show device load average (switches and APs only)
    env.enable_device_load yes

    # Show device uptime
    env.enable_device_uptime yes

    # Show number of clients connected to each device
    env.enable_clients_device yes
    # Show detailed graphs for each device (per device graphs)
    env.enable_detail_clients_device yes

    # Show number of clients connected to each network type
    env.enable_clients_type yes
    # Show detailed graphs for each client type (per type graphs)
    env.enable_detail_clients_type yes
    # Show unauthorized / authorized client list
    # if you are not using the guest portal, this is useless
    env.show_authorized_clients_type yes

    # Show transfer statistics on switch ports
    env.enable_xfer_port yes
    # Show detailed graphs per switch port
    env.enable_detail_xfer_port yes
    # Hide ports that have no link (When set to no, unplugged ports will transfer 0, not be undefined)
    env.hide_empty_xfer_port yes

    # Show transfer statistics per device
    env.enable_xfer_device yes
    # Show detailed graphs for each device
    env.enable_detail_xfer_device yes

    # Show transfer statistics per named network
    env.enable_xfer_network yes
    # Show detailed graphs for each named network
    env.enable_detail_xfer_network yes

    # Show transfer statistics per radio
    env.enable_xfer_radio yes
    # Show detailed graphs for each radio
env.enable_detail_xfer_radio yesAll scripts require
- Perl : WWW::Curl::Easy
- WWW::Curl is a Perl extension interface for libcurl.
- Perl : JSON
- JSON (JavaScript Object Notation) encoder/decoder
Pulling data from an API over a network is often not that fast - the more locally this is installed, probably the better. Using the dirtyconfig support means dropping the script from hitting the API 8 times total to hitting it only 4 times (login and 3 different endpoints)
The main performance concern on this is the huge number of graphs that may be generated. Using the cron version of munin-graph may hurt a lot.
A bit of a case study:
| My Site | UBNT Demo | |
|---|---|---|
| Devices | 8 | 126 |
| AP's | 4 | 118 |
| 24xSwitch | 1 | 5 |
| 8xSwitch | 2 | 2 |
| Output Bytes | 64,262 | 431,434 |
| Output Lines | 1,761 | 14,586 |
| Output Graphs | 77 | 530 |
So, just note that the growth in the amount of graphed data can be extream.
(That said, on my configuration, and with a locally cached source, the demo site can be parsed in a around 0.15 second - I have not graphed all 530 - I'm guessing it would take a while.)
Eventually this will all get dropped into the munin contrib repository. But I figured the community would want to test and make changes first.
If you have anything else you want added, drop a new one here, or open an issue with the suggestion (pointing out the API node you want added would be hugely helpful - it's not well docuemted)
Thanks to the following:
-
hhansen06 - Forum Post - Did an initial PHP plugin that sparked the idea.
-
Art-of-WiFi - PHP API implementation that was borrowed from heavily to figure out appropriate endpoints.
