-
Notifications
You must be signed in to change notification settings - Fork 0
Flink Introduction
In this session, you'll learn what Apache Flink is and which use cases it addresses.
We mix a lecture-style presentation with interactive demos that you can run yourself. The demos are done in a Docker-based, sandboxed environment that is easy to start and stop. The demo environment provides a Flink cluster to play around with Flink and its features. It is based on Flink's operations playground.
We'll interrupt the presentation a few times for demos that show different features of Flink.
You should have prepared the tutorial environment at this point.
If you haven't done this yet, please do it now by following the preparation instructions.
The presentation slides are available online.
Start a command-line and enter the directory of the tutorial (flink-intro-tutorial).
Change into the operations playground folder (operations-playground) and start the Docker playground.
$ cd operations-playground
$ docker-compose up -d
Note: If you are using Windows, you need to share the Windows drive (for example C:) that you are starting the playground from with Docker. This is done in the "Shared Drives" tab of the Docker settings. Docker will mount the Flink configuration into the Flink containers and use the Windows file system to store checkpoint and savepoint data.
If you run docker-compose ps you should get the following output:
$ docker-compose ps
                    Name                                  Command               State                   Ports
-----------------------------------------------------------------------------------------------------------------------------
operations-playground_clickevent-generator_1   /docker-entrypoint.sh java ...   Up       6123/tcp, 8081/tcp
operations-playground_client_1                 /docker-entrypoint.sh flin ...   Exit 0
operations-playground_jobmanager_1             /docker-entrypoint.sh jobm ...   Up       6123/tcp, 0.0.0.0:8081->8081/tcp
operations-playground_kafka_1                  start-kafka.sh                   Up       0.0.0.0:9094->9094/tcp
operations-playground_taskmanager_1            /docker-entrypoint.sh task ...   Up       6123/tcp, 8081/tcp
operations-playground_zookeeper_1              /bin/sh -c /usr/sbin/sshd  ...   Up       2181/tcp, 22/tcp, 2888/tcp, 3888/tcp
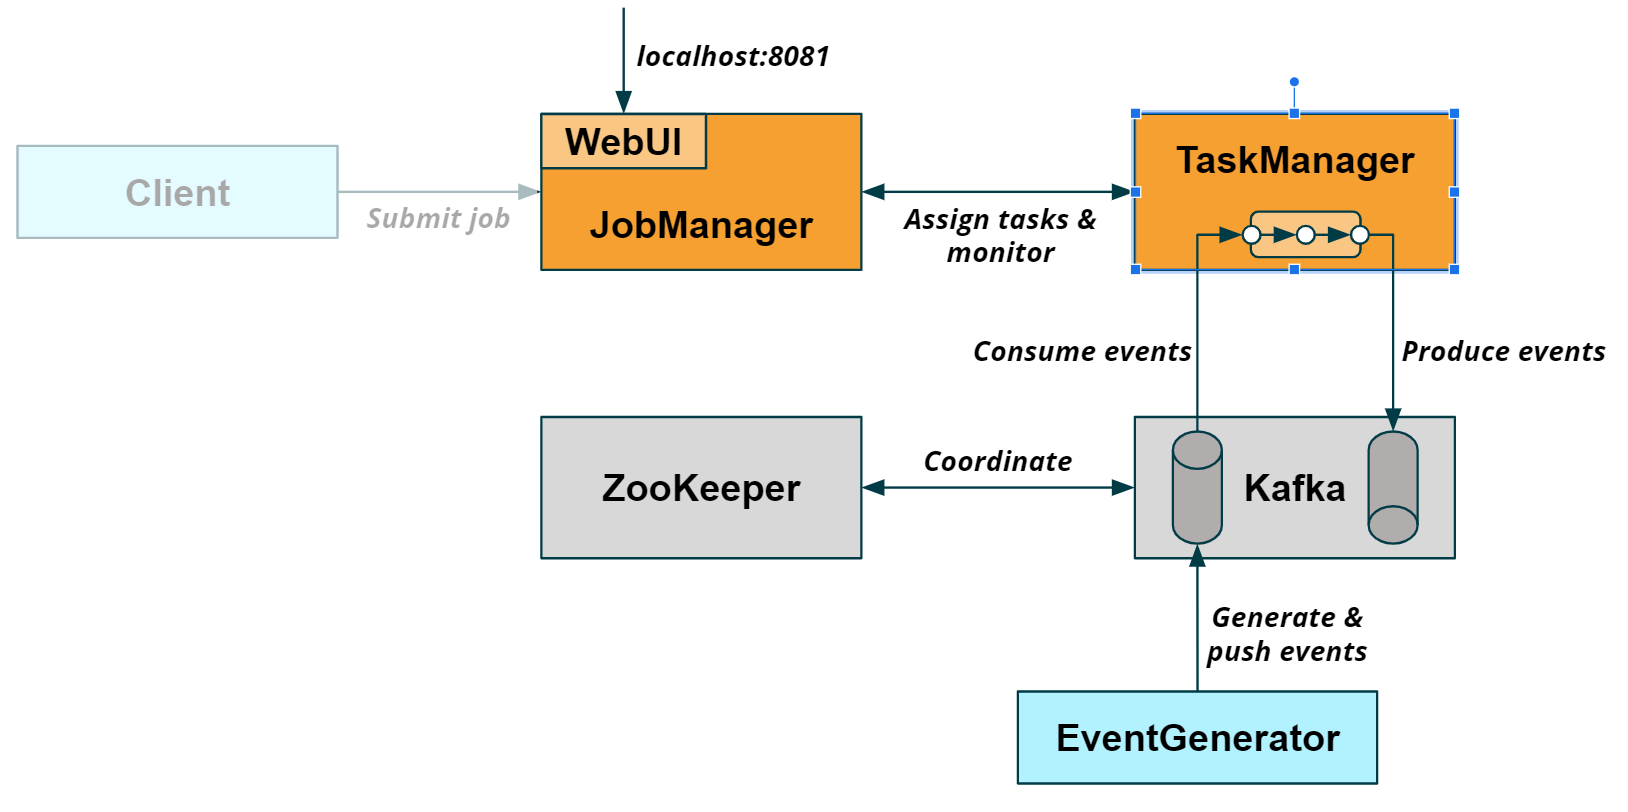
It shows that the environment consists of six Docker containers:
Two containers for the Flink cluster:
-
jobmanager_1is the master node of the Flink cluster. Every Flink cluster is coordinated by a JobManager. -
taskmanager_1is a worker node of the Flink cluster. A Flink cluster may have one or more TaskManagers to which the JobManager distributes tasks to execute.
Two containers for a Kafka cluster:
-
kafka_1is a Kafka broker. -
zookeeper_1is required by Kafka for distributed coordination.
Two containers for the demo environment:
-
clickevent-generator_1is a container that runs a data generator, which pushes events to a Kafka topic. -
client_1is a container that submitted a job to the Flink JobManager and terminated afterwards (hence, its state ofExit 0). The job is reading the generated from the Kafka topic, performing a computation, and writing the result to a second Kafka topic. We'll discuss the job in more detail later.
The following figure visualizes how the containers interact with each other:

When the Docker container are started, you can access Flink's WebUI at http://localhost:8081.
We leave the environment running during the presentation and tap into it for the demos.
If you want to stop the containers execute the following command
docker-compose down
This demo shows what a Flink stream processing application looks like and how it processes streaming data.
-
Open the WebUI (localhost:8081) in a browser.
-
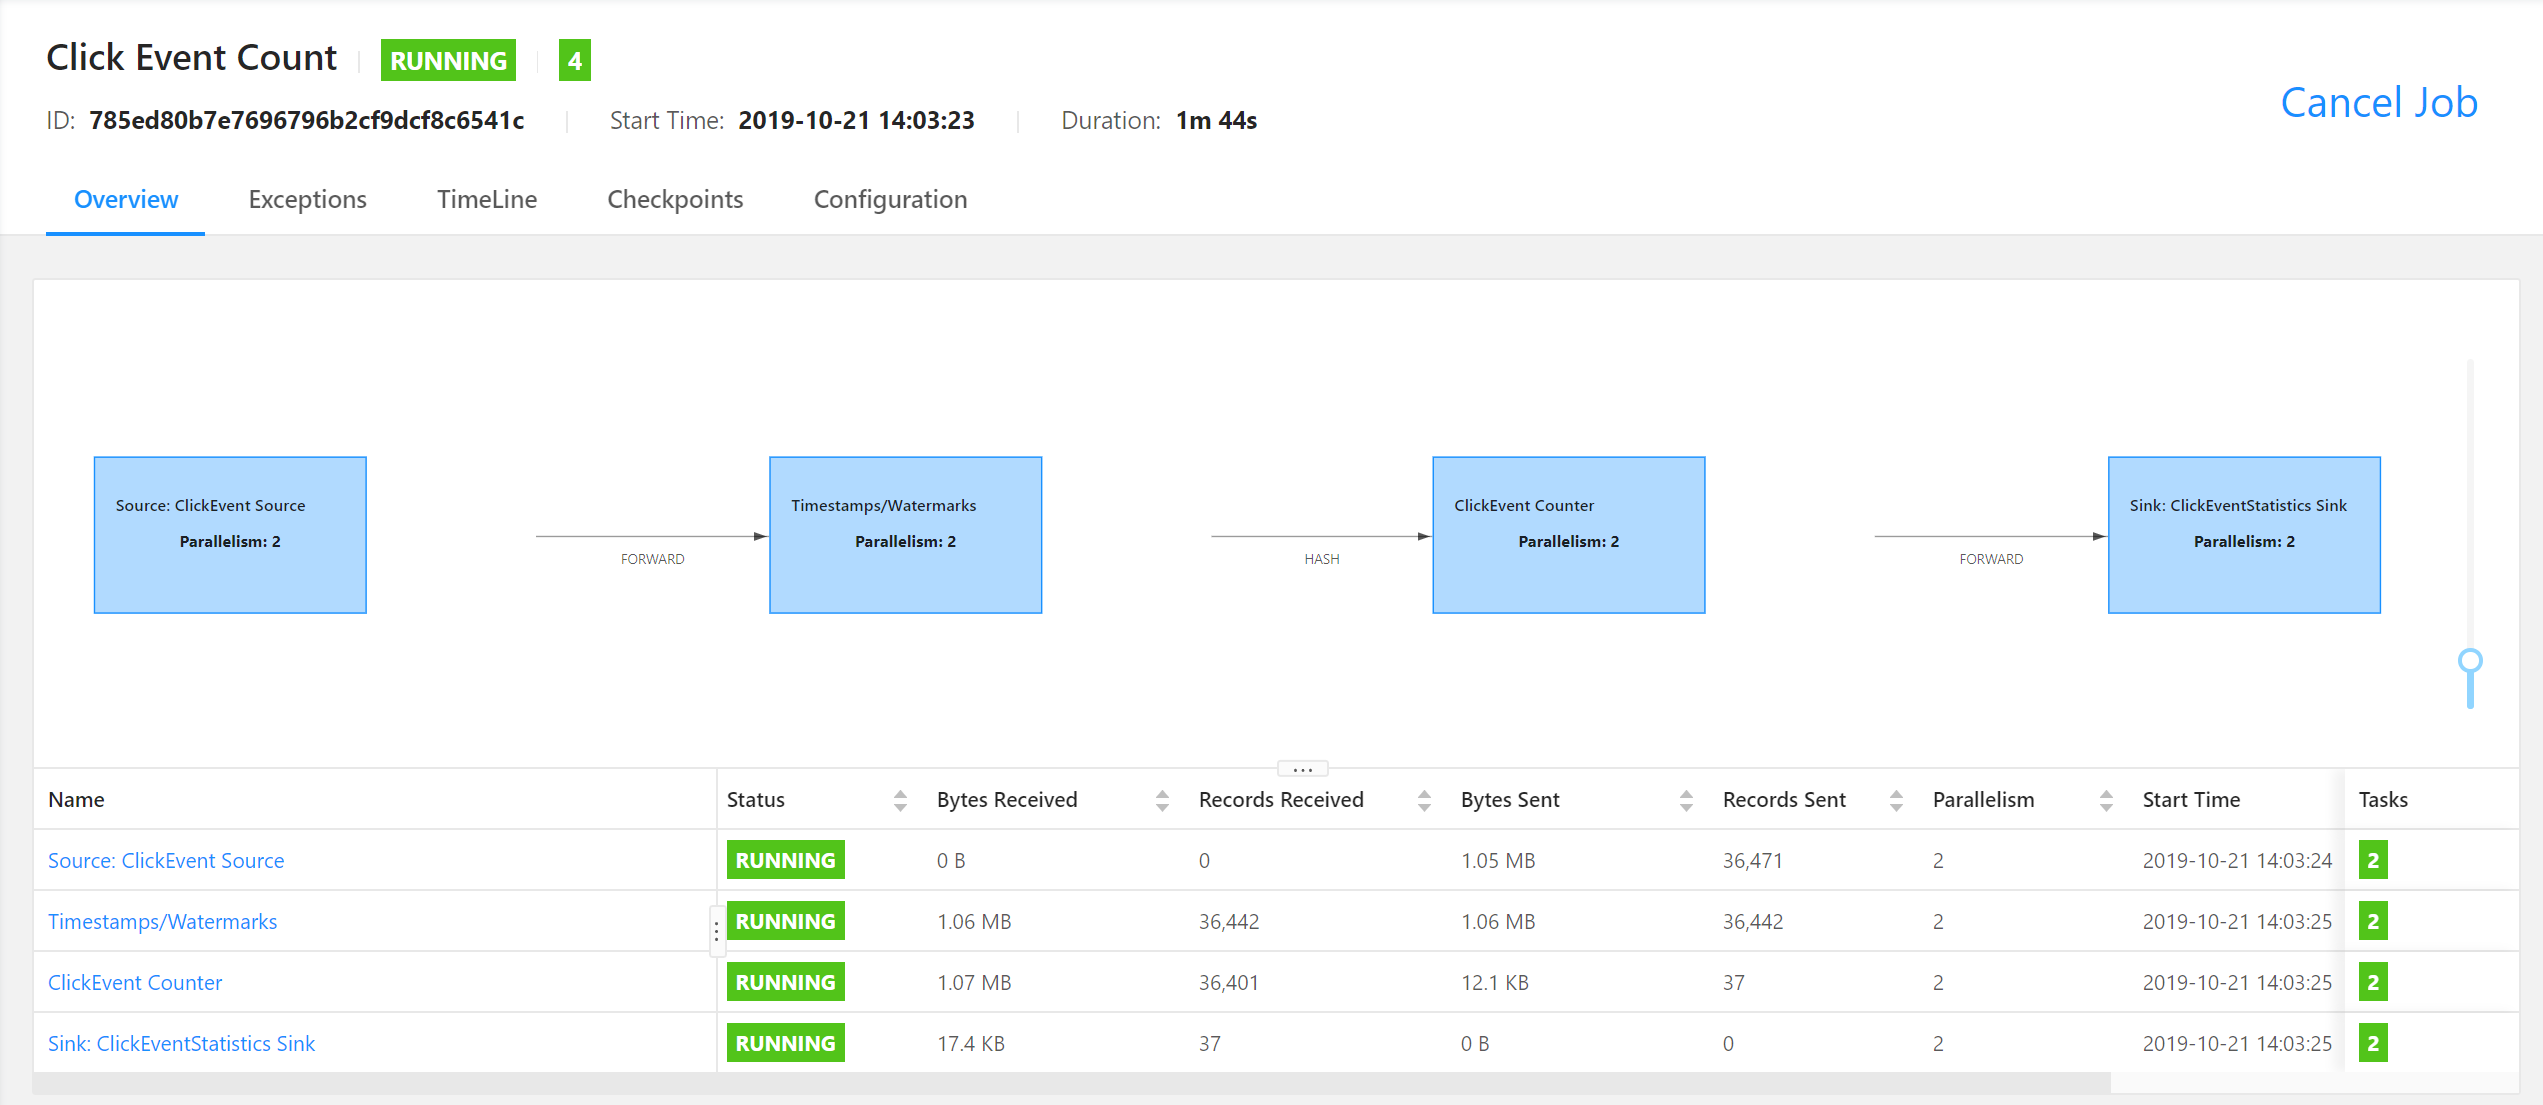
Click on the "Click Event Count" job in the "Running Jobs" List. You will see a visualization of the "Click Event Count" job. The table at the bottom shows basic statistics about the individual operators of the job.

- The job reads JSON-encoded records from a Kafka topic named
input. There is a simple data generator running that pushes data into that Kafka topic. Run the following command to see what is written into the topic.
$ docker-compose exec kafka kafka-console-consumer.sh --bootstrap-server localhost:9092 --topic input
{"timestamp":"01-01-1970 01:10:53:160","page":"/index"}
{"timestamp":"01-01-1970 01:10:53:160","page":"/shop"}
{"timestamp":"01-01-1970 01:10:53:160","page":"/jobs"}
{"timestamp":"01-01-1970 01:10:53:160","page":"/about"}
{"timestamp":"01-01-1970 01:10:53:160","page":"/news"}
{"timestamp":"01-01-1970 01:10:53:175","page":"/help"}
{"timestamp":"01-01-1970 01:10:53:175","page":"/index"}
{"timestamp":"01-01-1970 01:10:53:175","page":"/shop"}
{"timestamp":"01-01-1970 01:10:53:175","page":"/jobs"}
The data represents a stream of simple click events for a website. Each event has two fields, 1) the timestamp of when the click happened and 2) the page that was accessed.
-
The Flink job counts every 15 seconds how often each page was accessed. It consists of the following four operators that are subsequently applied after each other:
-
"ClickEvent Source" reads the JSON records from the
inputKafka topic, parses them, and emits them as JavaClickEventPOJOs. -
"Timestamps/Watermarks" receives the
ClickEventPOJOs, assigns event-time timestamps to the records, and generates watermarks (we will discuss this later). The records (with assigned timestamps) and watermarks are forwarded to the next operator. -
"ClickEvent Counter" partitions the
ClickEventrecords by page, groups them in windows of 15 seconds, and counts the number of records per window and page. It emits the results asClickEventStatisticsPOJOs. -
"ClickEventStatistics Sink" receives the records, encodes them as JSON strings, and writes those back to a Kafka topic
output.
-
"ClickEvent Source" reads the JSON records from the
-
Check the Kafka output topic
$ docker-compose exec kafka kafka-console-consumer.sh --bootstrap-server localhost:9092 --topic output
{"windowStart":"01-01-1970 01:17:15:000","windowEnd":"01-01-1970 01:17:30:000","page":"/shop","count":1000}
{"windowStart":"01-01-1970 01:17:15:000","windowEnd":"01-01-1970 01:17:30:000","page":"/index","count":1000}
{"windowStart":"01-01-1970 01:17:15:000","windowEnd":"01-01-1970 01:17:30:000","page":"/news","count":1000}
{"windowStart":"01-01-1970 01:17:15:000","windowEnd":"01-01-1970 01:17:30:000","page":"/about","count":1000}
{"windowStart":"01-01-1970 01:17:15:000","windowEnd":"01-01-1970 01:17:30:000","page":"/help","count":1000}
{"windowStart":"01-01-1970 01:17:15:000","windowEnd":"01-01-1970 01:17:30:000","page":"/jobs","count":1000}
{"windowStart":"01-01-1970 01:17:30:000","windowEnd":"01-01-1970 01:17:45:000","page":"/index","count":1000}
Every 15 seconds, the sink operator writes the click counts of all six pages to the Kafka topic. The data generator produces click events in such a way that the 15-second-counts for each page are always equal to 1000.
The Flink job runs continuously and does not stop to compute page click statistics until it is manually canceled or stopped.
In this demo we're going to explore Flink's checkpointing mechanism and failure recovery features. We start observing how Flink takes checkpoints of a running job and later observe how Flink recovers the job after we triggered a failure.
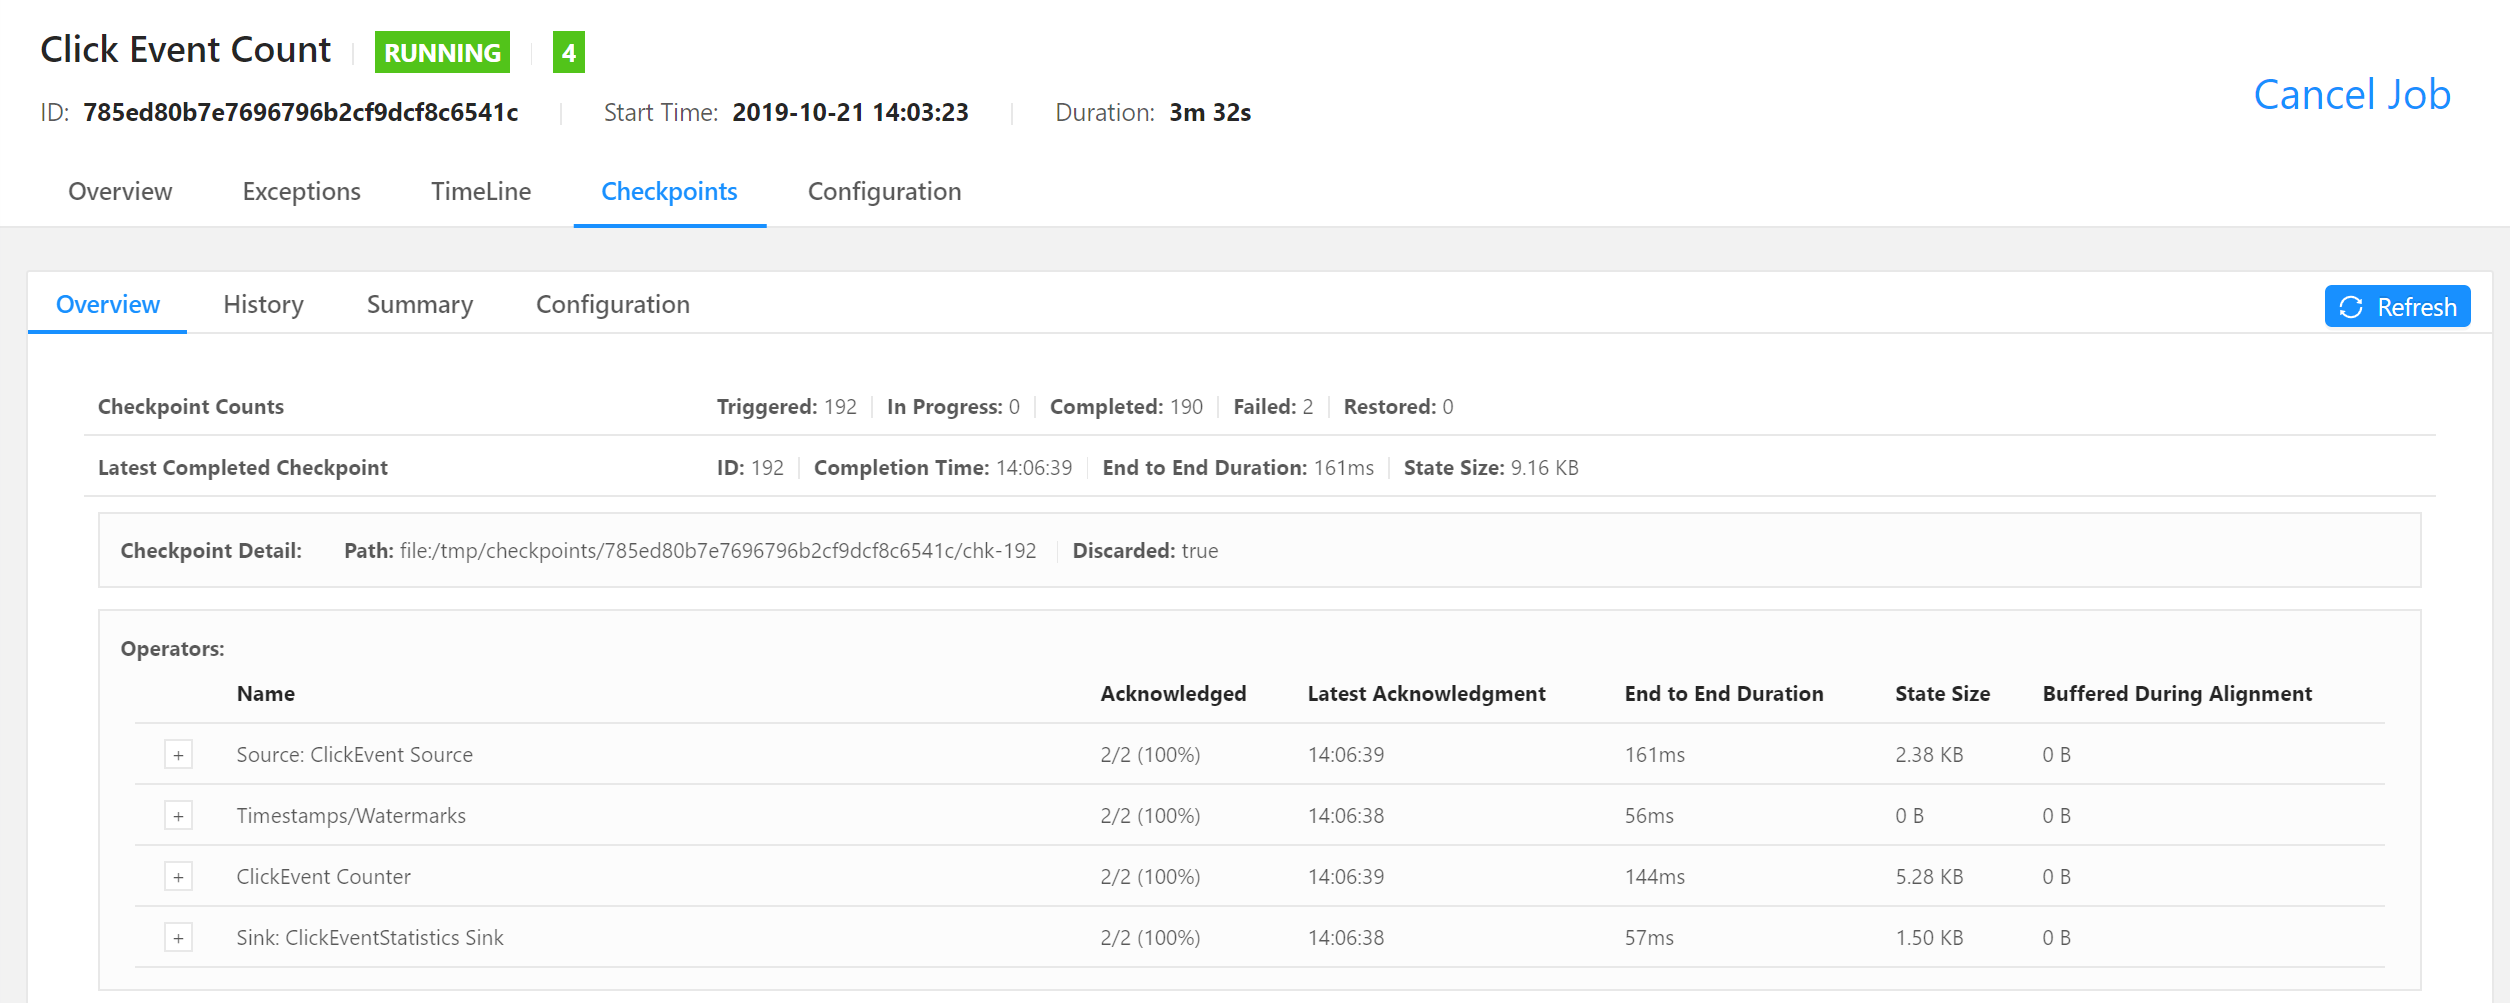
The "Click Event Count" job is configured to take every second a checkpoint of its state. You can check the progress of these checkpoints in the WebUI. Access the job details view and click on the "Checkpoints" tab at the top of the page. The Checkpoints overview page shows details about the last completed checkpoint.

This includes the total size of the checkpoint and the size of each operator's checkpointed state.
The operators checkpoint the following data:
- The source operator checkpoints the current reading of the Kafka partitions that it consumes from.
- The timestamps/watermarks operator is stateless and hence does not checkpoint any data.
- The ClickEvent Counter operator is a window operator which keeps the current count per window and page as state.
- The sink operator checkpoints some metadata to ensure the consistency of the output data.
As you see, the checkpointed data is very small. That's because the data generator only emits click events for six pages and for each page only one counter needs to be kept in state.
You can also check the progress of the checkpoints in your filesystem. The Flink cluster (and Docker environment) is configured to use the filesystem of your host system as persistent volume and write checkpoints to the ./operations-playground/checkpoints folder.
The checkpoints folder contains for each running job a folder that is named like the ID of the job.
$ ls -lh checkpoints
total 4,0K
drwxr-xr-x 5 root root 4,0K Okt  1 16:40 2c86e5e212a0b56470b593416448d125
The subfolder contains the checkpoint data of the job:
$ ls -l checkpoints/2c86e5e212a0b56470b593416448d125
total 12K
drwxr-xr-x 2 root root 4,0K Okt  1 16:40 chk-17069
drwxr-xr-x 2 root root 4,0K Okt  1 10:45 shared
drwxr-xr-x 2 root root 4,0K Okt  1 10:45 taskowned
The chk-17069 folder contains the data of the 17069's checkpoint of the job. When you repeatedly list the content of the checkpoints/<jobid> folder, you'll see how the name of the checkpoint folder changes and the checkpoint number increases. Since Flink takes a new checkpoint every second, every second a new folder is created. Folders of outdated checkpoints are automatically removed by Flink.
Flink's recovery mechanism ensures that the state of an application is consistent in case of a failure.
Let's see how Flink recovers a job after we introduced a failure. As a first step, let's observe the output os the job first. Open a new terminal, change into the operations-playground folder, call the following command and let it run.
$ docker-compose exec kafka kafka-console-consumer.sh --bootstrap-server localhost:9092 --topic output
Next, let's introduce a failure by killing the Flink worker container. Open a terminal, change into the operations-playground folder, and call
$ docker-compose kill taskmanager
to kill the worker container.
Open the WebUI and check what is happening to the job. It might take a few seconds until the Flink master notices that the worker process is lost. Once that happens, the master will cancel the running job and immediately resubmit it for recovery. However, since there are no more worker processes around that could start executing the tasks of the restarted job, the states remain in the SCHEDULED state, which is indicated by the purple colored square.
In order to successfully restart the job, we need to add a worker process to our cluster. We can do that by running the following command
docker-compose up -d taskmanager
After submitting the command, the new worker process will connect to the master. Once the new resources become available, the master will submit the tasks of the restarted job for execution to the worker. Finally, all tasks of the job switch to the RUNNING state and continue processing events.
Note In most production environments, a resource manager like Kubernetes, YARN, or Mesos will take care of automatically restarting failed worker processes. Hence recovery typically does not involve manual intervention and is fully automatic.
Since all states of the application, including Kafka reading offsets and counters were reset to a consistent point, the output of the job remains correct. When you check the output of the Kafka output topic, you will see that all counts are exactly 1000 proving that no record got lost and none got counted twice.
In addition to periodic checkpoints, you can also manually take a savepoint from a running application. Both, checkpoints and savepoints, are consistent snapshots of the state of an application. However, checkpoints are exclusively used for fault-tolerance and savepoints can be used for various operational tasks, including starting a bugfixed version of an application, migrating an application to a different cluster, or scaling an application up or down. Let's see in this demo how that works.
A savepoint can be triggered via Flink's REST API or CLI client. Here we use the CLI client, which is located inside the Flink Docker container and can be invoked via the docker-compose command.
The following command takes a savepoint from the job that is identified by the <job-id> and immediately stops it. You can find the <job-id> in the WebUI.
$ docker-compose run --no-deps client flink stop <job-id>
Suspending job "<job-id>" with a savepoint.
Savepoint completed. Path: <savepoint-path>
Flink is configured to store savepoints to the container-local path /tmp/savepoints which is mounted to the ./operations-playground/savepoints folder of your machine. The data of the savepoint should be located in this folder.
We took a savepoint and stopped the job. You could use this savepoint to do a bunch of interesting things. However to keep things simple, we just restart the job with a different parallelism.
The CLI command to start the job is a bit lengthy.
docker-compose run --no-deps client flink run -p 4 -s <savepoint-path> \
  -d /opt/ClickCountJob.jar \
  --bootstrap.servers kafka:9092 --checkpointing --event-time
The command contains the new parallelism (4), the path to the savepoint (/tmp/savepoints/...), the path to the job's JAR file (which is located in the client container), and some job-specific parameters.
When you check the WebUI you should find the new job. However, its tasks won't be not running yet. The reason is that due to the higher job parallelism, the Flink cluster does not have enough resources to execute all tasks of the job. We can fix that by simply starting a second worker container.
docker-compose scale taskmanager=2
Once the new TaskManager process registered itself at the JobManager, the tasks of the job get assigned to the workers and the job starts processing. You can check again the results of the job by subscribing to the output Kafka topic.
The job that we've used so far is operating with event-time semantics. Let's figure out what this actually means. First, we take a closer look at the input Kafka topic from which the job ingests its input.
$ docker-compose exec kafka kafka-console-consumer.sh --bootstrap-server localhost:9092 --topic input
{"timestamp":"01-01-1970 01:10:53:160","page":"/index"}
{"timestamp":"01-01-1970 01:10:53:160","page":"/shop"}
{"timestamp":"01-01-1970 01:10:53:160","page":"/jobs"}
{"timestamp":"01-01-1970 01:10:53:160","page":"/about"}
{"timestamp":"01-01-1970 01:10:53:160","page":"/news"}
{"timestamp":"01-01-1970 01:10:53:175","page":"/help"}
{"timestamp":"01-01-1970 01:10:53:175","page":"/index"}
{"timestamp":"01-01-1970 01:10:53:175","page":"/shop"}
{"timestamp":"01-01-1970 01:10:53:175","page":"/jobs"}
The timestamp field of the the events shows that the clicks apparently happened on January 1st, 1970. Moreover, the timestamp values are increasing per page.
Our job ingests the click events from Kafka, partitions them by page, groups them into consecutive, non-overlapping 15-second windows based on their timestamp field, counts the click events per window, and writes the result back to a Kafka topic.
Let's check the events in the output Kafka topic.
$ docker-compose exec kafka kafka-console-consumer.sh --bootstrap-server localhost:9092 --topic output
{"windowStart":"01-01-1970 01:17:15:000","windowEnd":"01-01-1970 01:17:30:000","page":"/shop","count":1000}
{"windowStart":"01-01-1970 01:17:15:000","windowEnd":"01-01-1970 01:17:30:000","page":"/index","count":1000}
{"windowStart":"01-01-1970 01:17:15:000","windowEnd":"01-01-1970 01:17:30:000","page":"/news","count":1000}
{"windowStart":"01-01-1970 01:17:15:000","windowEnd":"01-01-1970 01:17:30:000","page":"/about","count":1000}
{"windowStart":"01-01-1970 01:17:15:000","windowEnd":"01-01-1970 01:17:30:000","page":"/help","count":1000}
{"windowStart":"01-01-1970 01:17:15:000","windowEnd":"01-01-1970 01:17:30:000","page":"/jobs","count":1000}
{"windowStart":"01-01-1970 01:17:30:000","windowEnd":"01-01-1970 01:17:45:000","page":"/index","count":1000}
The result events include timestamps for the start and end of the windows. Since, the click events were grouped into windows based on their timestamp, the timestamps of the window boundaries also date back to January 1st, 1970. Another observation is that the count is always exactly 1000 (as guaranteed by the data generator).
Now let's see what happens if we run the same job with processing-time semantics instead of event-time semantics. First, we cancel the running event-time job via the WebUI. The "Cancel Job" button is on the top right of the job overview page
Next, we start observing the output Kafka topic.
$ docker-compose exec kafka kafka-console-consumer.sh --bootstrap-server localhost:9092 --topic output
Finally, we start our demo job with different arguments to enable processing-time semantics.
$ docker-compose run --no-deps client flink run -p 2 -d /opt/ClickCountJob.jar --bootstrap.servers kafka:9092 --checkpointing
If you look closely, you'll find that we dropped the --event-time argument from the job parameters which configured the job with event-time semantics. Note that, the --event-time parameter is a specific feature of the demo job, not a general feature of Flink jobs.
Now, let's check the output of the job that is produced into the output Kafka topic that we observe.
{"windowStart":"04-10-2019 03:51:30:000","windowEnd":"04-10-2019 03:51:45:000","page":"/help","count":3834}
{"windowStart":"04-10-2019 03:51:30:000","windowEnd":"04-10-2019 03:51:45:000","page":"/news","count":3834}
{"windowStart":"04-10-2019 03:51:30:000","windowEnd":"04-10-2019 03:51:45:000","page":"/jobs","count":3834}
{"windowStart":"04-10-2019 03:51:30:000","windowEnd":"04-10-2019 03:51:45:000","page":"/index","count":3835}
{"windowStart":"04-10-2019 03:51:30:000","windowEnd":"04-10-2019 03:51:45:000","page":"/shop","count":3835}
{"windowStart":"04-10-2019 03:51:30:000","windowEnd":"04-10-2019 03:51:45:000","page":"/about","count":3834}
{"windowStart":"04-10-2019 03:51:45:000","windowEnd":"04-10-2019 03:52:00:000","page":"/index","count":1149}
{"windowStart":"04-10-2019 03:51:45:000","windowEnd":"04-10-2019 03:52:00:000","page":"/about","count":1149}
{"windowStart":"04-10-2019 03:51:45:000","windowEnd":"04-10-2019 03:52:00:000","page":"/shop","count":1149}
{"windowStart":"04-10-2019 03:51:45:000","windowEnd":"04-10-2019 03:52:00:000","page":"/jobs","count":1149}
{"windowStart":"04-10-2019 03:51:45:000","windowEnd":"04-10-2019 03:52:00:000","page":"/news","count":1149}
When comparing this to the output of the same job that was started with event-time semantics we notice two things:
- The start and end timestamps are not aligned with the
timestampfield of the input data anymore. That's because processing-time windows are aligned with the clock of the local machine. - The counts are no longer exactly 1000 but can be very different. A processing-time window assigns events based on the machine time when the event is received and not based on the timestamp that's part of the data. In the example above, the significantly higher counts of the first window results are caused by events that were buffered in Kafka while no job was consuming them (the generator was still pushing events into Kafka). When the new job was started, the buffered events were quickly ingested and flushed into the first window.
This little demo shows the differences between event-time and processing-time semantics. While event-time jobs are data-driven and deterministic, processing-time jobs depends on external factors such as backpressure, machine load, etc. Moreover, processing-time cannot be used to process stored or buffered data but only "live" data (if at all). If you had taken a savepoint of the first job and submitted the processing-time job twice from the same point, you would have received different results. An event-time job would produce both times the same result.
Apache Flink, Flink®, Apache®, the squirrel logo, and the Apache feather logo are either registered trademarks or trademarks of The Apache Software Foundation.