-
Notifications
You must be signed in to change notification settings - Fork 70
Performance
Vitaly Ustinov edited this page Jun 2, 2016
·
14 revisions
$ nproc
1

$ cat /proc/meminfo | grep MemTotal
MemTotal:        1884384 kB

$ uname -m
x86_64

$ cat /etc/centos-release
CentOS Linux release 7.2.1511 (Core)
$ java -version
java version "1.8.0_91"
Java(TM) SE Runtime Environment (build 1.8.0_91-b14)
Java HotSpot(TM) 64-Bit Server VM (build 25.91-b14, mixed mode)

$ echo $CATALINA_OPTS
-Xms512M -Xmx1G
Connection settings ($CATALINA_HOME/conf/server.xml): default
    <Connector port="8080" protocol="HTTP/1.1"
               connectionTimeout="20000"
               redirectPort="8443" />
| CPU count | requests/sec | response time | screenshot | Gatling report |
|---|---|---|---|---|
| 1 | 100 | 6 ms |  |
download |
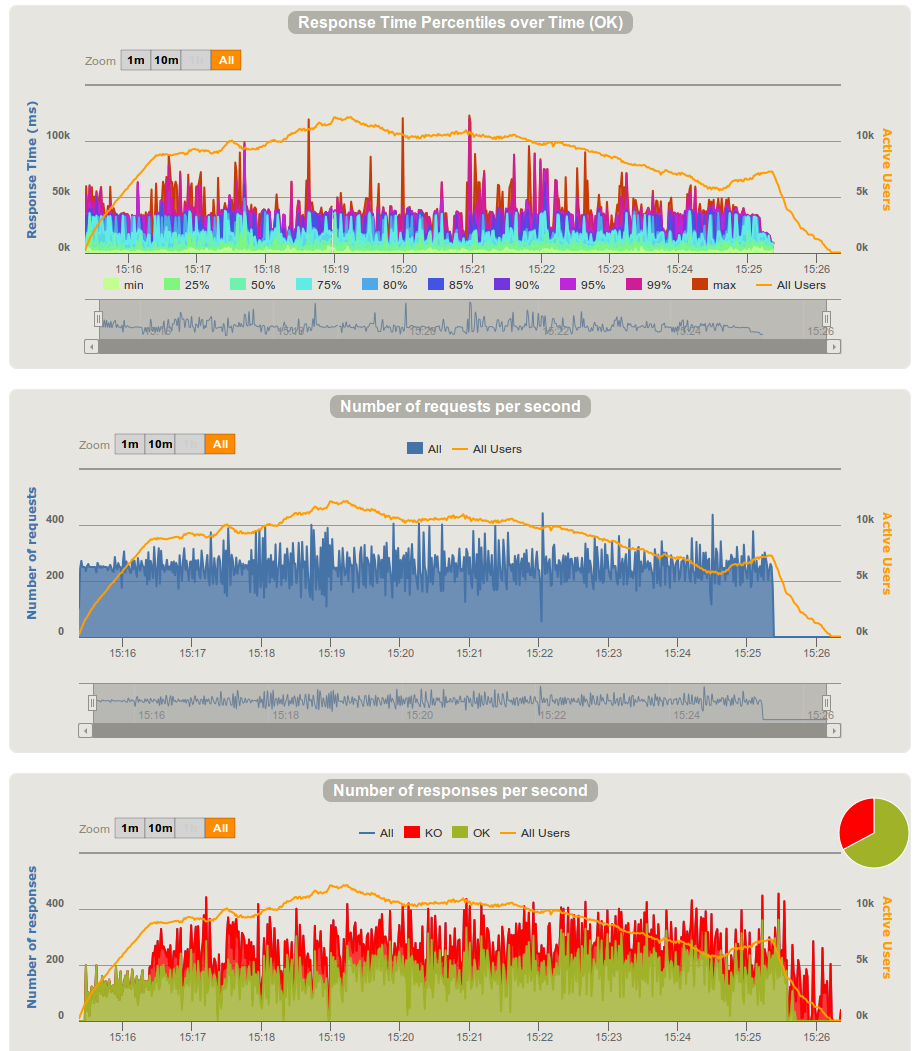
| 1 | 250 | 35000 ms 33% failed |
 |
download |
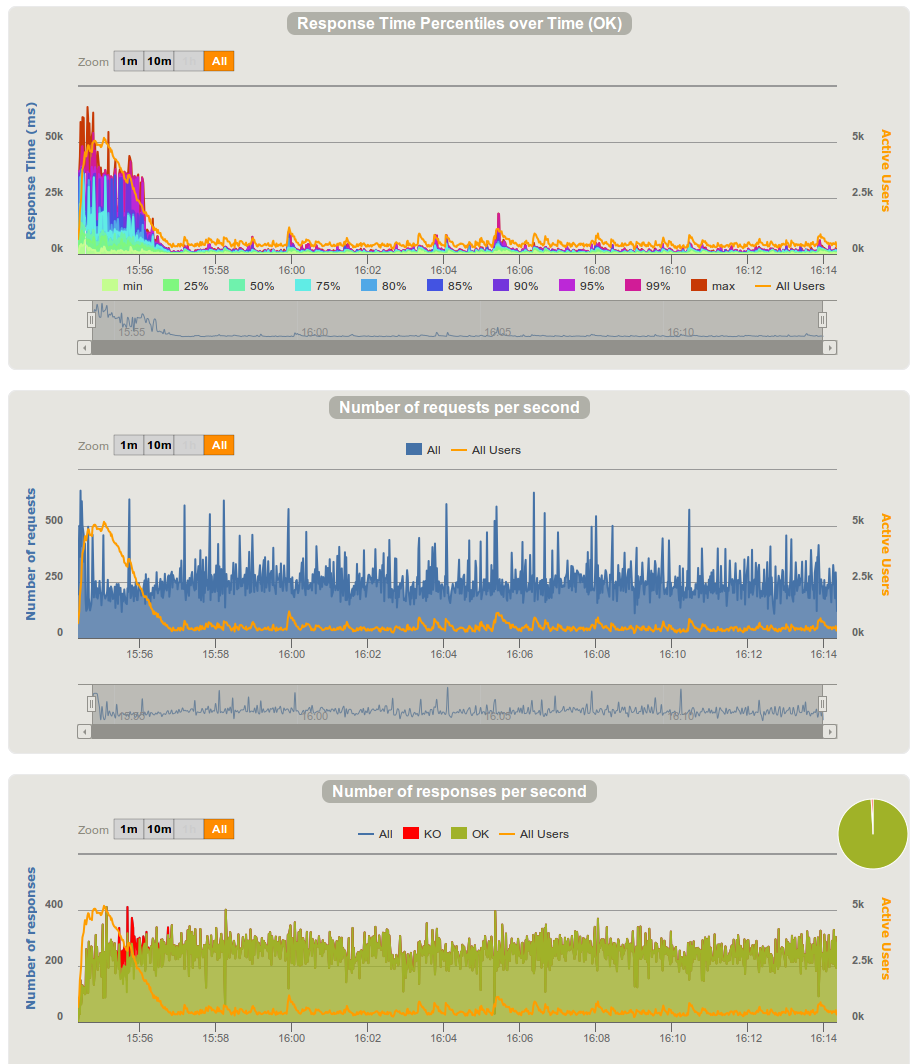
| 2 | 500 | 380 ms |  |
download |
2 CPUs, 500 users/sec, 10 min

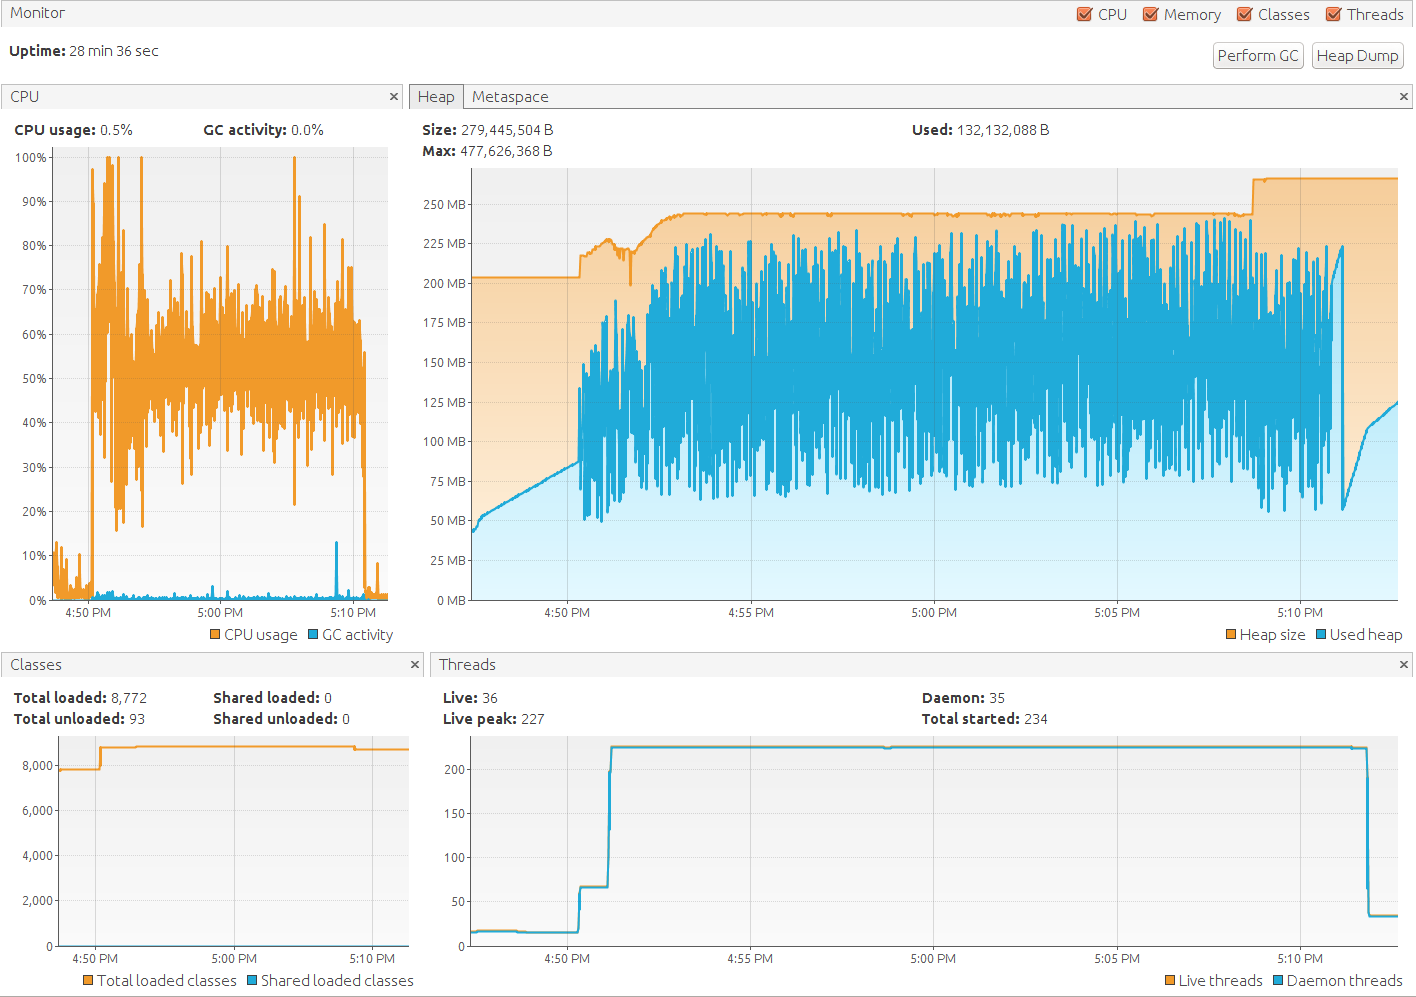
2 CPUs, 500 users/sec
