Weather Monitoring System which monitors the temperature and light intensity using analog sensors and plots the changes over a period of time.
- LM35 Temperature Sensor
- Breadboard
- Jumper Wires
- 2k ohm resistor
- C
- tm4c123gh6pm.h
- Python3
- Tkinter
- matplotlib
- csv
- datetime
- LM35
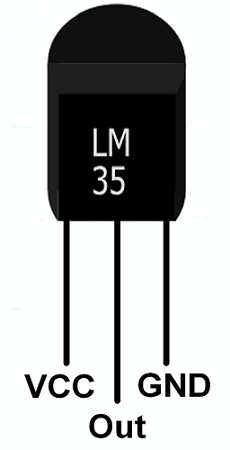
- The LM35 has three pins.
- The first pin is connected to Vcc of the board.
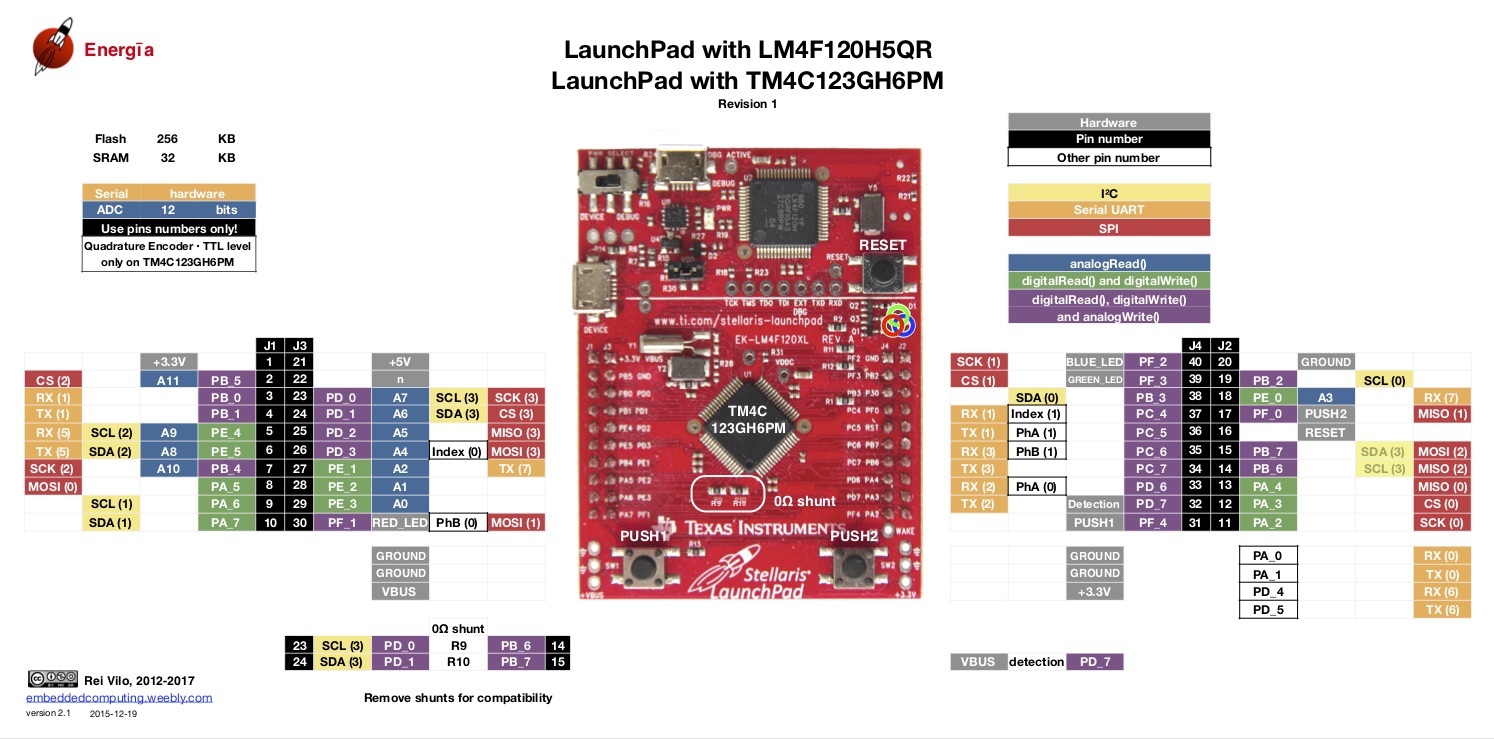
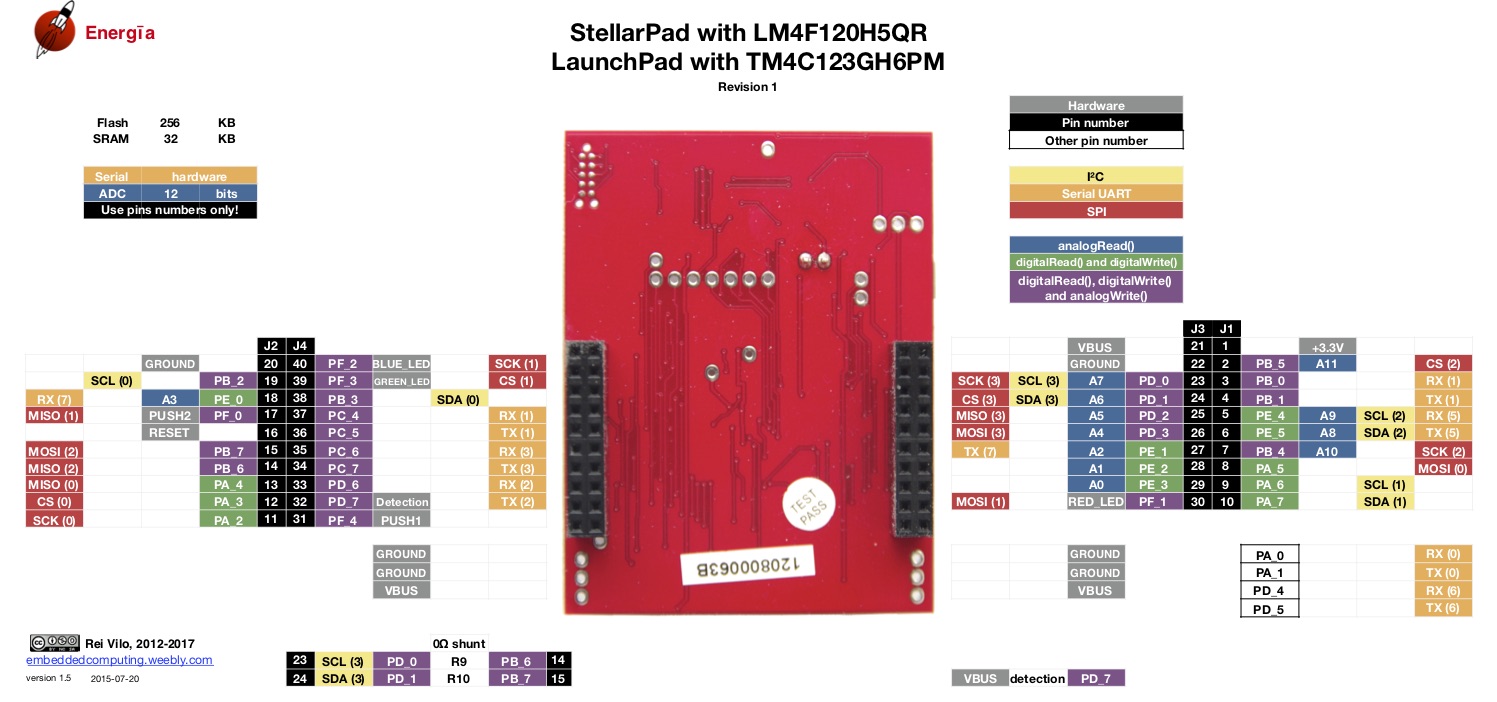
- The second pin is the data pin, it is connected to AIN0 i.e. PE3 pin of the board.
- The third pin is connected to the GND of the board.
- Photoresistor
- The photoresistor has two pins.
- The first pin is connected to the Vcc of the board.
- The second pin is connected to
- The AIN1 i.e. PE2 pin on the board
- The GND pin of the board through a resistor
- The LM35 is a frequently used temperature sensor. It is calibrated to degrees Celsius, ensuring that the readings obtained from the sensor are directly proportional to degrees Celsius values.
- The output voltage has a scale factor of 10mV per degree Celsius.
- The sensor has a range of -55 oC to 150 oC. Its accuracy ranges from 0.25 oC to 0.75 oC.
- The sensor has two configurations:
- Basic Centigrade configuration
- Full range Centigrade configuration
- Here, the basic configuration is used, which can measure temperature in the range of 2 - 150 oC.
- For our purposes, we convert the value obtained into a Fahrenheit value.
- The ADC channel in TM4C123GH6PM has 12 bits and a maximum of 4096 steps.
- The maximum operating temperature of the LM35 is 300F, consequently, the maximum output will be 3000mV i.e. 3 V.
- The resolution obtained in this case, using a Vref of 3.3V is
3.3V/4096 = 0.0008V = 0.8mV
- Equations to calculate the temperature
VOUT(mV) = 10mV/°C * T
T = (ADC_RESULT * VREF)/4096 * 0.01 °C
T = (ADC_RESULT * VREF * 100)/4096 °C
T = (ADC_RESULT * 330) / 4096 °C
- The photoresistor has an inversely proportional relationship with the illumination.
- Here, with ADC of 12 bits, the value of light intensity is obtained as a percentage as
L = (ADC_RESULT) / 4096
- Upload the C code to a TM4C123GH6PM board through IAR Workbench or Keil.
- Make the required connections between the components.
- Run the code through workbench.
- Run the GUI.py code.
- Open the serial connection between the GUI and the board through COM3 port's UART0 terminal, through the 'Open Connection' button.
- Get the values of the Temperature and Light Intensity through the 'Weather' button.
- Plot the values and observe the changes over the period of time through the 'Plot' button.
- Close the connection and the window with the 'Close Connection' button.


.jpg)


