- X-wide association study (XWAS) is a data-driven method to find what variables in the set 'X' are associated with a phenotype (call it Y, e.g., telomere length)
- Originally presented at ISEE/ISES 2018, Ottawa, Canada on August 26 2018
- Chirag J Patel (chirag hms dot harvard dot edu)
- Twitter/GitHub: @chiragjp (https://twitter.com/chiragjp)
- web: http://www.chiragjpgroup.org
- Funding support: NIEHS R00 ES023504, NIEHS R21 ES025052, NIAID R01 AI127250, NSF 1636870
- familiarity with programming and data structures
- familiarity with R and regression
- R (version 3.3.3 or greater)
- Rstudio (version 1.01 or greater)
- Packages: survey, tidyverse, knitr, and broom
- download 'xwas_tutorial.Rmd' in RStudio from here: https://github.com/chiragjp/xwas_with_nhanes_tutorial/blob/master/xwas_tutorial.Rmd
- knit the .Rmd in Rstudio
- or download a pre-knitted file: https://github.com/chiragjp/xwas_with_nhanes_tutorial/blob/master/xwas_tutorial.html
- Part 1, Data analytics to enable X-wide Association Studies (XWASs): https://github.com/chiragjp/xwas_with_nhanes_tutorial/blob/master/ISEE%20Data%20Analytics%20Workshop%20083018.pdf
- Part 2, Introduction to the hands-on tutorial to get you started to executing X-wide Association Studies (XWASs) with survey data: https://github.com/chiragjp/xwas_with_nhanes_tutorial/blob/master/ISEE%20Data%20Analytics%20Hands%20On%20082618.pdf
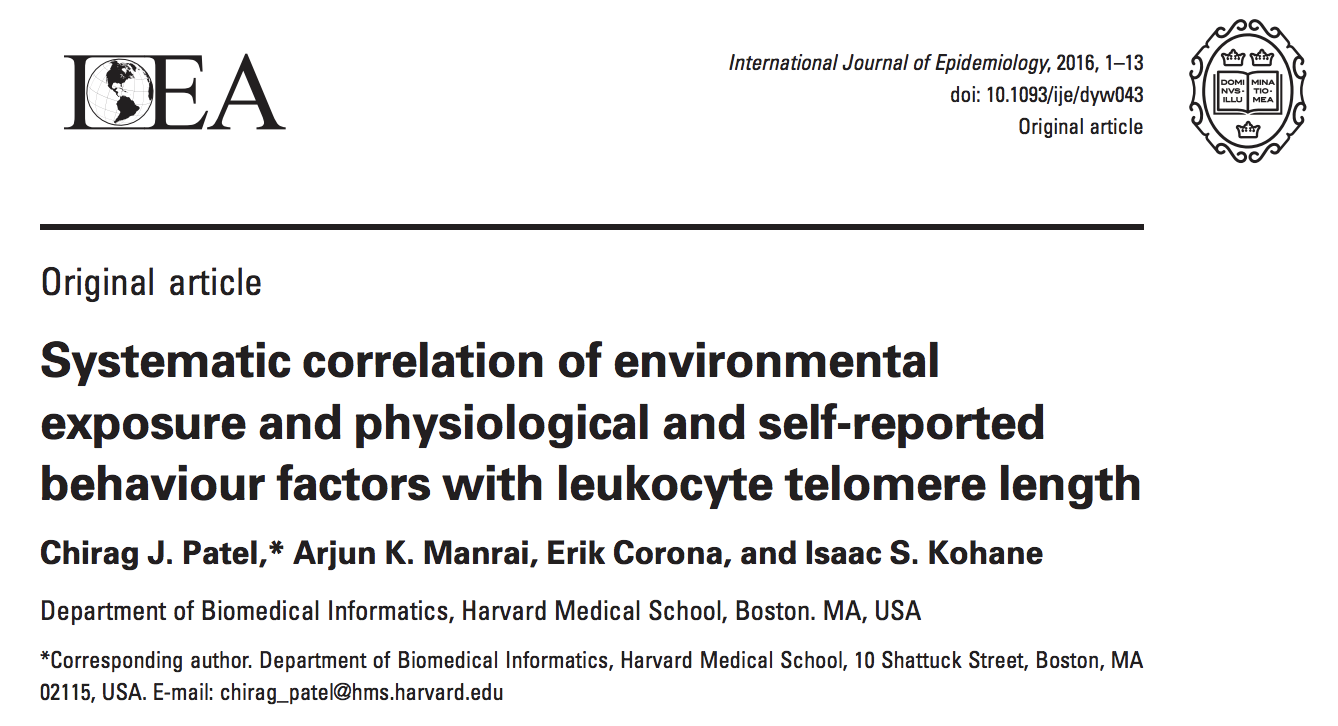
- Patel CJ, et al, International Journal of Epidemiology 2016
- https://www.ncbi.nlm.nih.gov/pubmed/27059547
- Send a 'pull' request in GitHub to incorporate your answers in a new version of the .Rmd or R code!
- https://services.github.com/on-demand/github-cli/open-pull-request-github
- What is your interpretation of the association sizes and pvalues for your XWAS?
- How much to the coefficients change for the adjustment variables for each of the correlations?
- Attempt to reproduce the findings in Patel et al., IJE 2016 (https://www.ncbi.nlm.nih.gov/pubmed/27059547) using more categories of exposure. How will you handle other X variables, such as self-reported variables?
- When increasing the number of variables, how would the pvalue threshold change to accommodate more tests? How would the FDR change, if at all?
- Execute the XWAS in another phenotype. What are the similarties and differences between your analysis in 1.
- How much variance explained in telomeres do the top factors explain? Is this to be expected?
- Implement the XWAS without using the
foroperator using the tidyverse suite of commands.
