-
Notifications
You must be signed in to change notification settings - Fork 71
Debugging Seaside Applications
From Seaside - A Multiple Control Flow Web Application Framework, Ducasse, Lienhard, Renggli
Most of today’s frameworks do not support debugging of web applications well. Most display the error and the line number in the web browser only, which makes it very inconvenient to find and fix bugs.
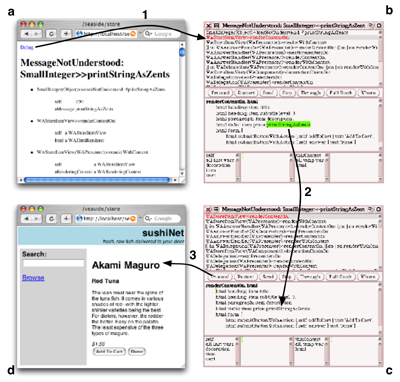
When an unhandled exception occurs (see figure below), a stack trace is shown in the web browser (a) with a link called debug. Clicking this link (1), the developer activates a debugger (b) within the development environment which lets him inspect variables and even modify the code on the fly. In the given example the message printStringAsCents, that is automatically highlighted in the debugger (b), has been spelled wrongly and is fixed (2) by the developer. The debugger now displays the recompiled method (c). During this time, the web browser keeps waiting for the response of the server. When hitting proceed (3), the processing of the request which had caused the error is resumed and the resulting page is finally displayed in the web browser (d).
This feature makes debugging web applications very powerful: there is no manual recompilation and restarting of the web server required. The developer is put right back into the questionable page where he is able to see if he fixed the error properly and is able to continue the testing session.

Changelogs
- (newer changelogs, see https://github.com/SeasideSt/Seaside/releases)
- 3.4.0
- 3.3.0
- 3.2.4
- 3.2.2
- 3.2.1
- 3.2.0
- 3.1.3
- 3.1.2
- 3.1.1
- 3.1.0
- 3.0.11
- 3.0.9
- 3.0.8
- 3.0.7
- 3.0.6
- 3.0.5
- 3.0.4
- 3.0.3
- 3.0.2
- 2.8
- 2.7
- Past Releases
Development
Documentation
- Configuration and Preferences
- Embedding Subcomponents
- Maintaining State
- Generating HTML
- CSS and Javascript
- Debugging Seaside Applications
- Links, Forms and Callbacks
- Development Tools
- Call and Answer
- Naming URLs
- Security Features
- Securing Seaside Applications
- Seaside-REST
- Add-On Libraries
- Persistence
- Gettext
- FileLibrary
- The Render Tree
- PDF Generation
- Long-Term Issues
- Ajaxification
- Web Components
- Big Issues
Sprints