Dietary choices and nutrition behaviors are highly individual and change day to day. Many variables weigh heavily on a person's food choices:
- Access to food
- Work/school schedule
- Taste preference
- Culture
The decision of what foods to eat is further complicated by
- A person’s knowledge/understanding of diet and nutrition
- The Internet (media, online forums, etc.)
- Social media
All these factors make identifying factual and unbiased information regarding nutrition an increasingly difficult task.
While it is largely difficult for scientific methods to account for all of the individual variations of diet preferences and access, information regarding nutritional content of food can be leveraged to develop data driven interpretations of foods.
Our primary aim for this project is to create an interactive visualization dashboard of a selection of foods and their nutritional contents (sourced from the United States Department of Agriculture (USDA) Food Data Central resource).
You can reach our Streamlit dashboard here:https://share.streamlit.io/tantar/uncovering-the-nutritional-landscape-of-food/main/UNLF.py. Currently we support three different types of visualizations for individual foods, comparison between foods, and the user's personal diet with recommendations.
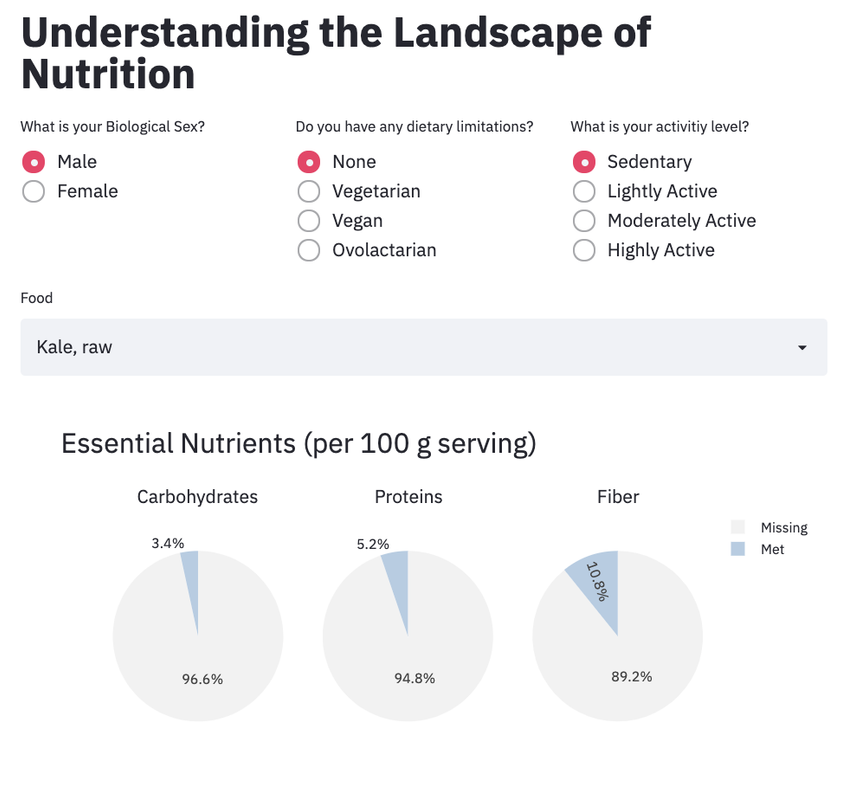
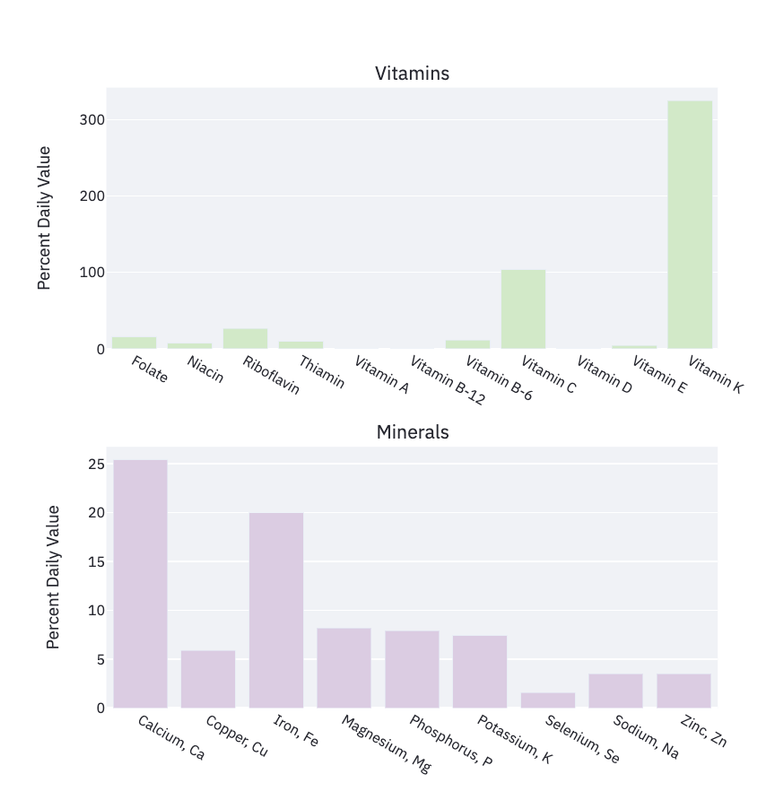
Individual view: If a user was interested in viewing the nutrition content for a single food item, they can select the Individual Foods option. Within this option, a food such as ocean perch can be evaluated for its carbohydrate, protein, and fiber content in comparison to USDA daily recommended intake, as well as a selection of nutrients including: Vitamins A, D, E, K, and C, B vitamins, calcium, copper, iron, magnesium, phosphorus, potassium, selenium, sodium, and zinc. An example of this visualization is shown below.
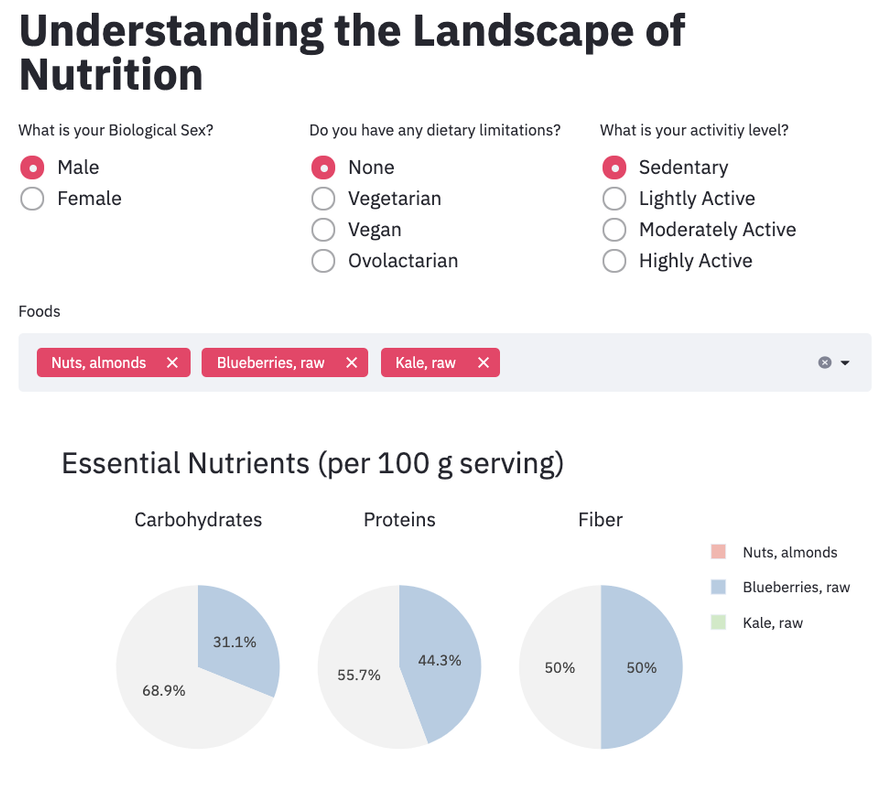
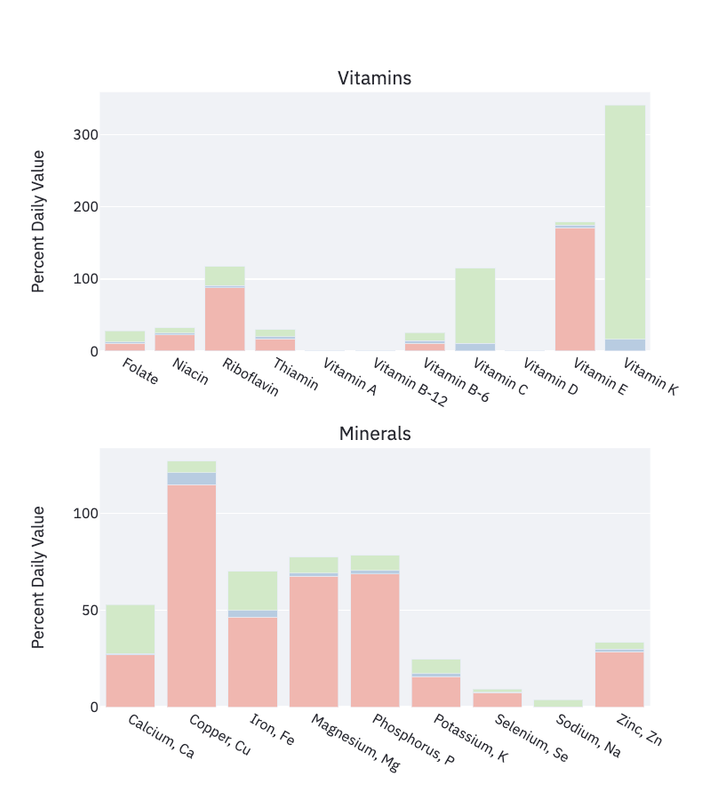
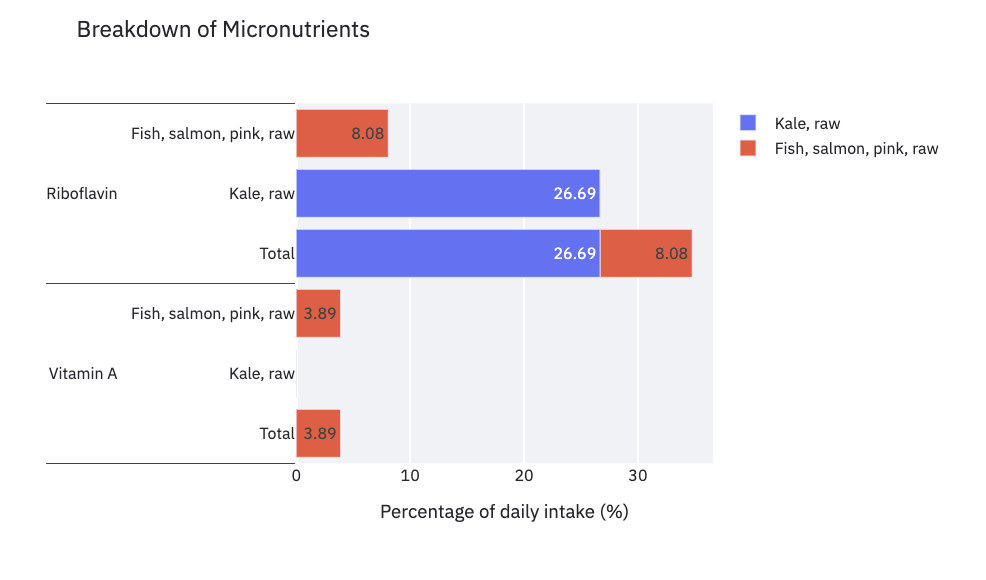
Comparison view: For users interested in viewing a nutrient comparison between multiple foods, the Comparison view allows for selection of various foods of interest and reports nutrient content. All nutrient options are consistent with those available in the Individual view, however this view is specifically color-coded to allow for consistent identification of what food item is contributing to each nutrient's daily recommended intake. This visualization can be seen here.
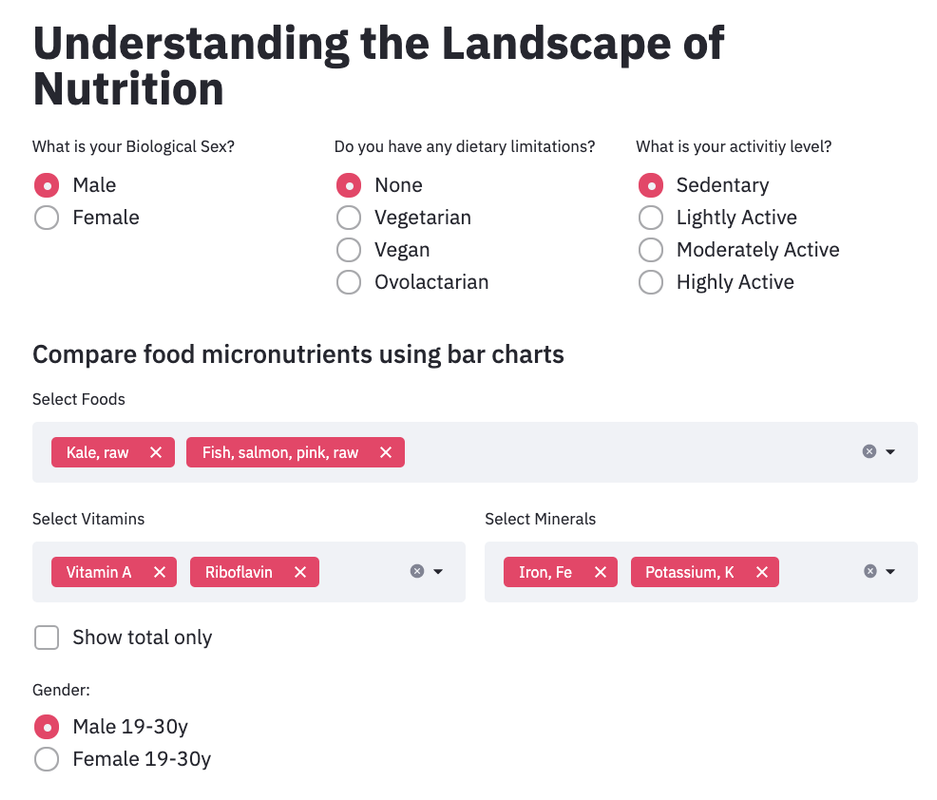
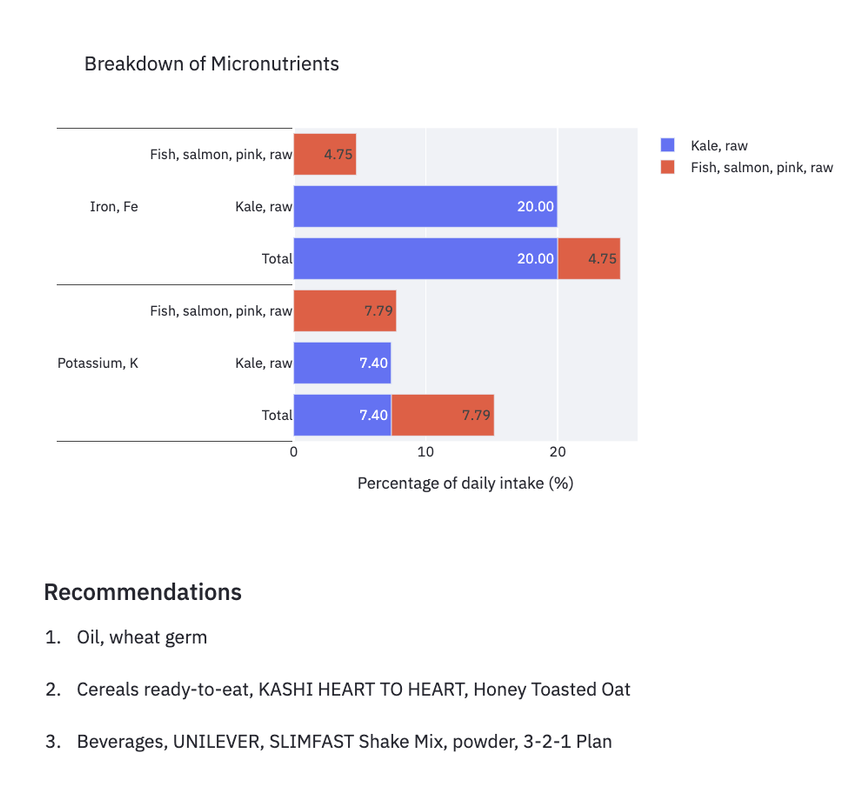
Diet with Recommendations view: This view is for individuals interested in gaining insight into how their current diet meets the daily recommended intake for each nutrient with recommendations on how to meet their daily needs. Within the Diet with Recommendations view users can select multiple foods and their nutrients of interest to receive visualization of that data. Additionally, in this view users will receive three recommended foods that are specifically selected to improve the nutrient content of the listed diet to meet dietary reference ranges. Dietary limitation and activity level information is not currently functional within this view.An example of this visualization is displayed below.
All data on Dietary Reference Intakes are from the USDA (https://www.nal.usda.gov/sites/default/files/fnic_uploads/recommended_intakes_individuals.pdf) and are currently only applicable for individuals ages 19-30 years old.
This freely available dashboard only requires internet access. Any individual who is interested in using the dashboard is able to interact with it on their local machine.
First, an individual would need to download the datasets described in the "Datasets Used for this Project" section below. Once the foods and nutrient values are integrated into a single dataset, they would then need to calculate what percent of each nutrients recommended daily intakes it met by individual foods. If you are interested in skipping and using our aggregated dataset, it is made available in the data folder of our github. Individuals looking to replicate and edit the dashboard created for this project will need to download python and install the streamlit and plotly libraries. If interested in using our code, that is made readily available within our GitHub and can also be found in a condensed file on Zenodo. LINK
We hope to continue refining our dashboard to include greater functionality and customization for users in a future codeathon. Our next steps for this project are to 1) increase the number of foods and nutrients our dashboard can reference, 2) automate updating of data from USDA FDC, 3) include macronutrients within the Diet + Recommendation view, 4) include all age bracket options for dietary reference intakes, 5) include activity level specific customizations 6) allow for the serving size to be customized, and 7) pursue user testing and elicit feedback.
-
"Uncovering the Nutritional Landscape of Food by Kim" et al. S1 Dataset. Foods analyzed in this study
Eric Ruan - Computer Science Undergrad at SBU
Eva Jason - Postbaccalaureate IRTA in the NICHD
Kyle Pu - Computer Science Undergrad at UCLA
Lauren Chan - PhD Candidate in Nutrition at Oregon State University
Tarek Antar - Postbaccalaurate IRTA in the NIA
Adam Thomas - NIMH
Dustin Moraczewski - NIMH
Kim S, Sung J, Foo M, Jin Y-S, Kim P-J (2015) Uncovering the Nutritional Landscape of Food. PLoS ONE 10(3): e0118697. https://doi.org/10.1371/journal.pone.0118697
