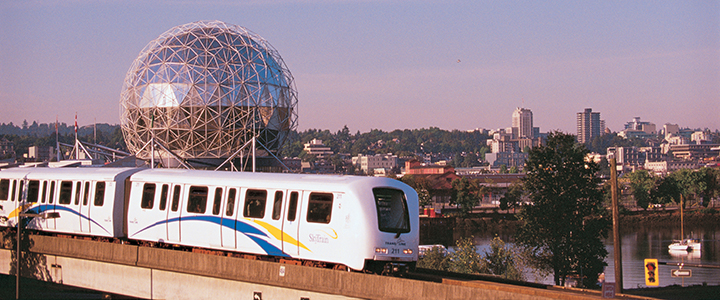
The primary project code, project data, and deployed dashboard code can be found in the code, data, and dashboard_deployed directories, respectively. Other documentation and presentation related materials are described in the remaining directories. The executive summary is detailed below, noting that Metropolitan Vancouver and its cultural amenities were used as a proof of concept example on how our project code could be leveraged and applied.
Dashboard Link: Vancouver Transit Accessibility to Cultural Amenities Dashboard
Introduction
Transportation network analysis is fundamental to urban planning for it determines how resources are distributed across a population. Resources come in the form of amenities such as grocery stores, schools, parks, and hospitals. Our client, Statistics Canada produces data to better understand Canada’s population, resources, economy, society, and culture. They have previously developed network accessibility measures based on distance of driving, and walking to compute proximity scores for various types of amenities.
Problem
Accessibility measures based on time using transit have not yet been incorporated into proximity scores due to its multi-modal complexity and computational intensity. In 2016, 22.3% of Canadians depended on public transit in large cities; thus, incorporating transit accessibility measures is paramount to not under-represent large segments of the population which can inevitably worsen pre-existing inequalities in the urban landscape.
Objective
The aim of this project was to establish a first iteration of an open source scalable framework for data collection and analysis of transit accessibility measures. We validated our framework on Vancouver, raising the question of, “How accessible are Vancouver’s cultural amenities (libraries, museums, art galleries, and theatres) using the current transit system?”
Methodology/Results
To address the computational intensity of multimodal shortest path routing, we use Conveyal’s R5 realistic routing algorithm available in R as r5r. It allows us to compute over 5.3 million transit routes repeatedly, 360 times in a day over 3 days, in just a matter of one hour. The travel time matrix was then used to develop three accessibility measures: one based on time, one on scores, and one on percentiles which were visualized with Leaflet and Kepler.gl and embedded in an R shiny dashboard.
Conclusion
This project provides a high performing and scalable framework for producing three unique transit accessibility measures for network analysis using Greater Vancouver as an initial use-case scenario. The frameworks can be further developed and adopted by urban developers to ensure equitable, sustainable, and optimal urban design for years to come.
Authors:
Luka Vukovic, Yuxuan Cui, Rain Shen, Graham Kerford
