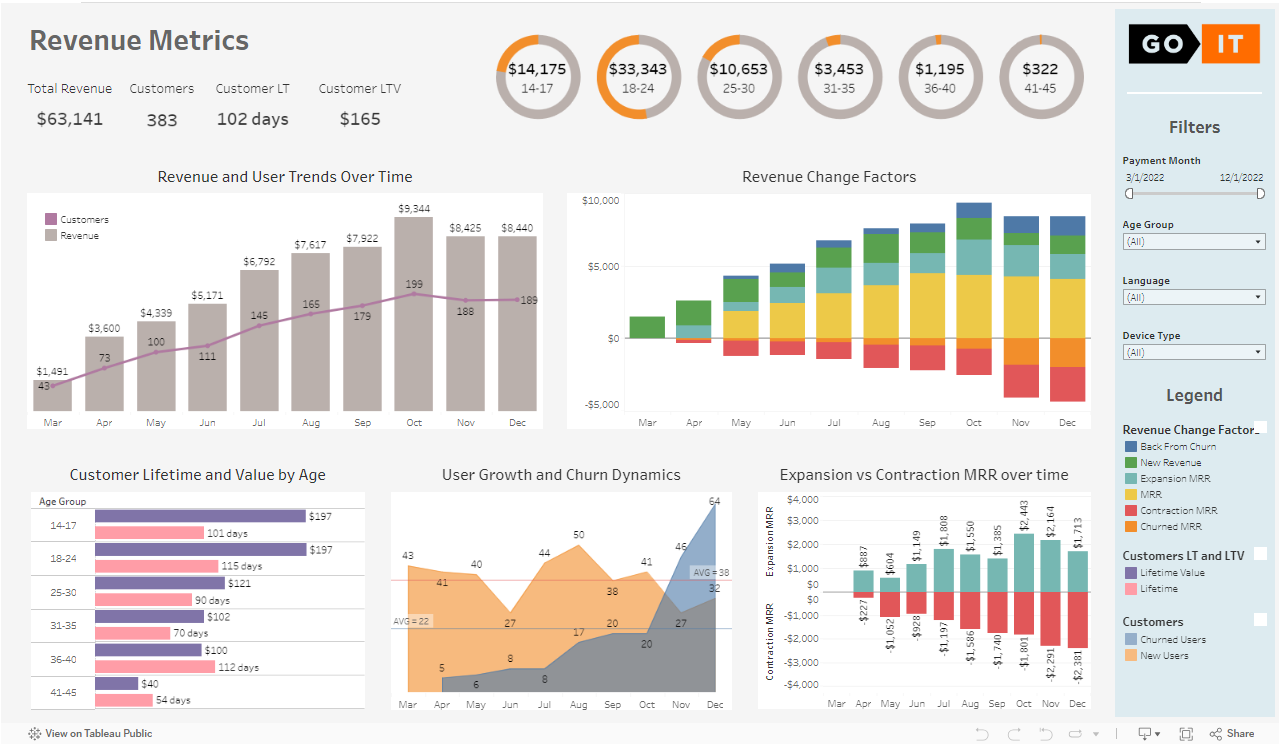
The Revenue Metrics Dashboard aims to provide a comprehensive tool for analyzing financial inflows within the project. This dashboard is designed to empower product managers with insights into the dynamics of financial changes and facilitate high-level analysis of the factors influencing these changes.
The dashboard includes the following key metrics:
- Monthly Recurring Revenue (MRR): Monthly revenue from recurring subscriptions.
- Average Revenue Per Paid User (ARPPU): Average revenue generated per paying user.
- New Paid Users: Count of users who started paying within a specific period.
- New MRR: MRR generated by users who became paying customers in a given month.
- Churned Users: Number of users who stopped paying within a specific time frame.
- Churn Rate: Ratio of churned users in the target period to paid users in the previous period.
- Churned Revenue: Cumulative revenue from all users who stopped paying in the previous period.
- Revenue Churn Rate: Ratio of revenue from users who did not continue paying in the previous month to MRR from the previous month.
- Expansion MRR: Increase in MRR from users who paid more in the current month compared to the previous month.
- Contraction MRR: Decrease in MRR from users who paid less in the current month compared to the previous month.
- Customer Lifetime (LT): Average time from the first payment to user churn.
- Customer Lifetime Value (LTV): Average total revenue generated by a user over their entire usage period.
The project leveraged advanced techniques in SQL and data visualization tools such as Tableau:
- SQL Queries: Utilized complex SQL queries to aggregate and compute metrics from the "games_payments" and "games_paid_users" tables in PostgreSQL.
- Data Aggregation: Employed SQL aggregations to calculate MRR, churn metrics, and customer lifetime metrics.
- Tableau Visualizations: Created interactive dashboards using Tableau, incorporating table calculations and Level of Detail (LOD) expressions to visualize trends, distributions, and correlations.
- Analytics Tools: Applied analytics tools to visualize and interpret the data effectively, enabling stakeholders to make data-driven decisions.
Click the image above to view the interactive Revenue Metrics Dashboard on Tableau's website.
The Revenue Metrics Dashboard provides actionable insights into revenue trends, user behavior, and customer lifetime value, enabling product managers to optimize strategies and maximize financial outcomes. By tracking key metrics and leveraging advanced analytical techniques, this dashboard supports informed decision-making and strategic planning for sustainable growth
