Still under construction. I just need some freetime :)
The aim of this project is to investigate the performance of Machine Learning and especially Natural Language Processing in predicting the stock market direction. The basic principle is buy low and sell high, but the complexity is in knowing when to buy and when to sell a stock.
Four types of analysis exist to forecast the markets:
- Fundamental (Long term investors like Warren Buffet)
- Technical (Day Traders approach)
- Quantitative (Building mathematical models to simulate market trends)
- Sentiment (The atmosphere around buying and selling)
They each have their own underlying principles, techniques, tool, and strategies, and understanding each one of them and combining the result of all is more optimal than relying solely on one.
News articles will be collected from Investing.com by web scraping using Selenium and Beautiful Soup. Sentiment analysis will then be performed using large pre-trained models on financial data including Finbert and Flair from Hugging Face to find sentiment scores before combining the results with historical stock price data to determine whether news sentiment influences stock price direction.
In addition we will use Large Language Models (LLMs) that are fine-tuned on stock and stock news to predict the movements based on the sentiment of the texts. (Still under coding ...).
Technical analysis is the use of charts and technical indicators to identify trading signals and price patterns. Various technical strategies will be investigated using the most common leading and lagging trend, momentum, volatility and volume indicators including Moving Averages, Moving Average Convergence Divergence (MACD), Stochastic Oscillator, Relative Strength Index (RSI), Money Flow Index (MFI), Rate of Change (ROC), Bollinger Bands, and On-Balance Volume (OBV).
A time series is basically a series of data points ordered in time and is an important factor in predicting stock market trends. In time series forecasting models, time is the independent variable and the goal is to predict future values based on previously observed values.
Stock prices are often non-stationary and may contain trends or volatility but different transformations can be applied to turn the time series into a stationary process so that it can be modelled.
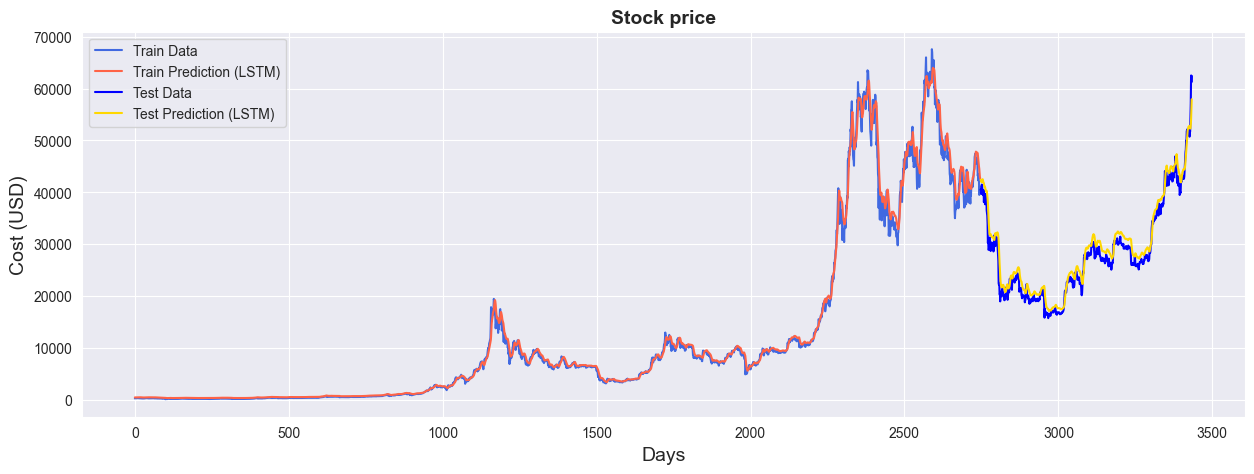
Recurrent Neural Network (RNN) models such as Simple RNN, Long Short-Term Memory (LSTM) and Gated Recurrent Units (GRU) will also be explored and various machine learning and deep learning models created, trained, tested and optimised.
The dataset is obtained by using the apis in yahoo finance and web scraping on investing.com on the news for the 30 trending stocks in New York Stock Exchange.
- Difference between the news' headline and the body
- The real time that the news will have it's effect
- The prices of a stock can change significantly in a day by different news
- The number of news for each stock differs, a stock like TMTG's last 100 news start from 2021 until today and for NVDA it starts from the start of March 2023 to end of March 2023
- The news for some dates for certain stocks are unavailable
- Numpy
- Pandas
- Matplotlib
- Mplfinance
- Seaborn
- Plotly
- SciPy
- Statsmodels
- Scikit-learn
- Keras
- TensorFlow
- Yfinance
- Beautiful Soup
- Selenium
- NLTK
- TextBlob
- SpaCy
- Gensim
- BERT
- Hugging Face
- PyTorch
- lightweight_charts
- tabulate

