A toolkit to collect physiological data from two remote devices, save it to a csv file with synchronized timestamps, send it to a server, and visualize its time-windowed raw data/its synchronicity.
Our current version only supports BITalino (eeg, ecg, eda, emg) as a sensor to use. We plan to increase the options of sensors in the near future.
BITalino needs OpenSignals, an official software to acquire signals from BITalino via Bluetooth. Please install this software beforehand.
OpenRBSync uses ngrok for tunneling. Please download following here.
Run the following command and install OpenRBSync.
git clone https://github.com/rkmtlab/OpenRBSync.git
- Other required libraries are written in requirements.txt
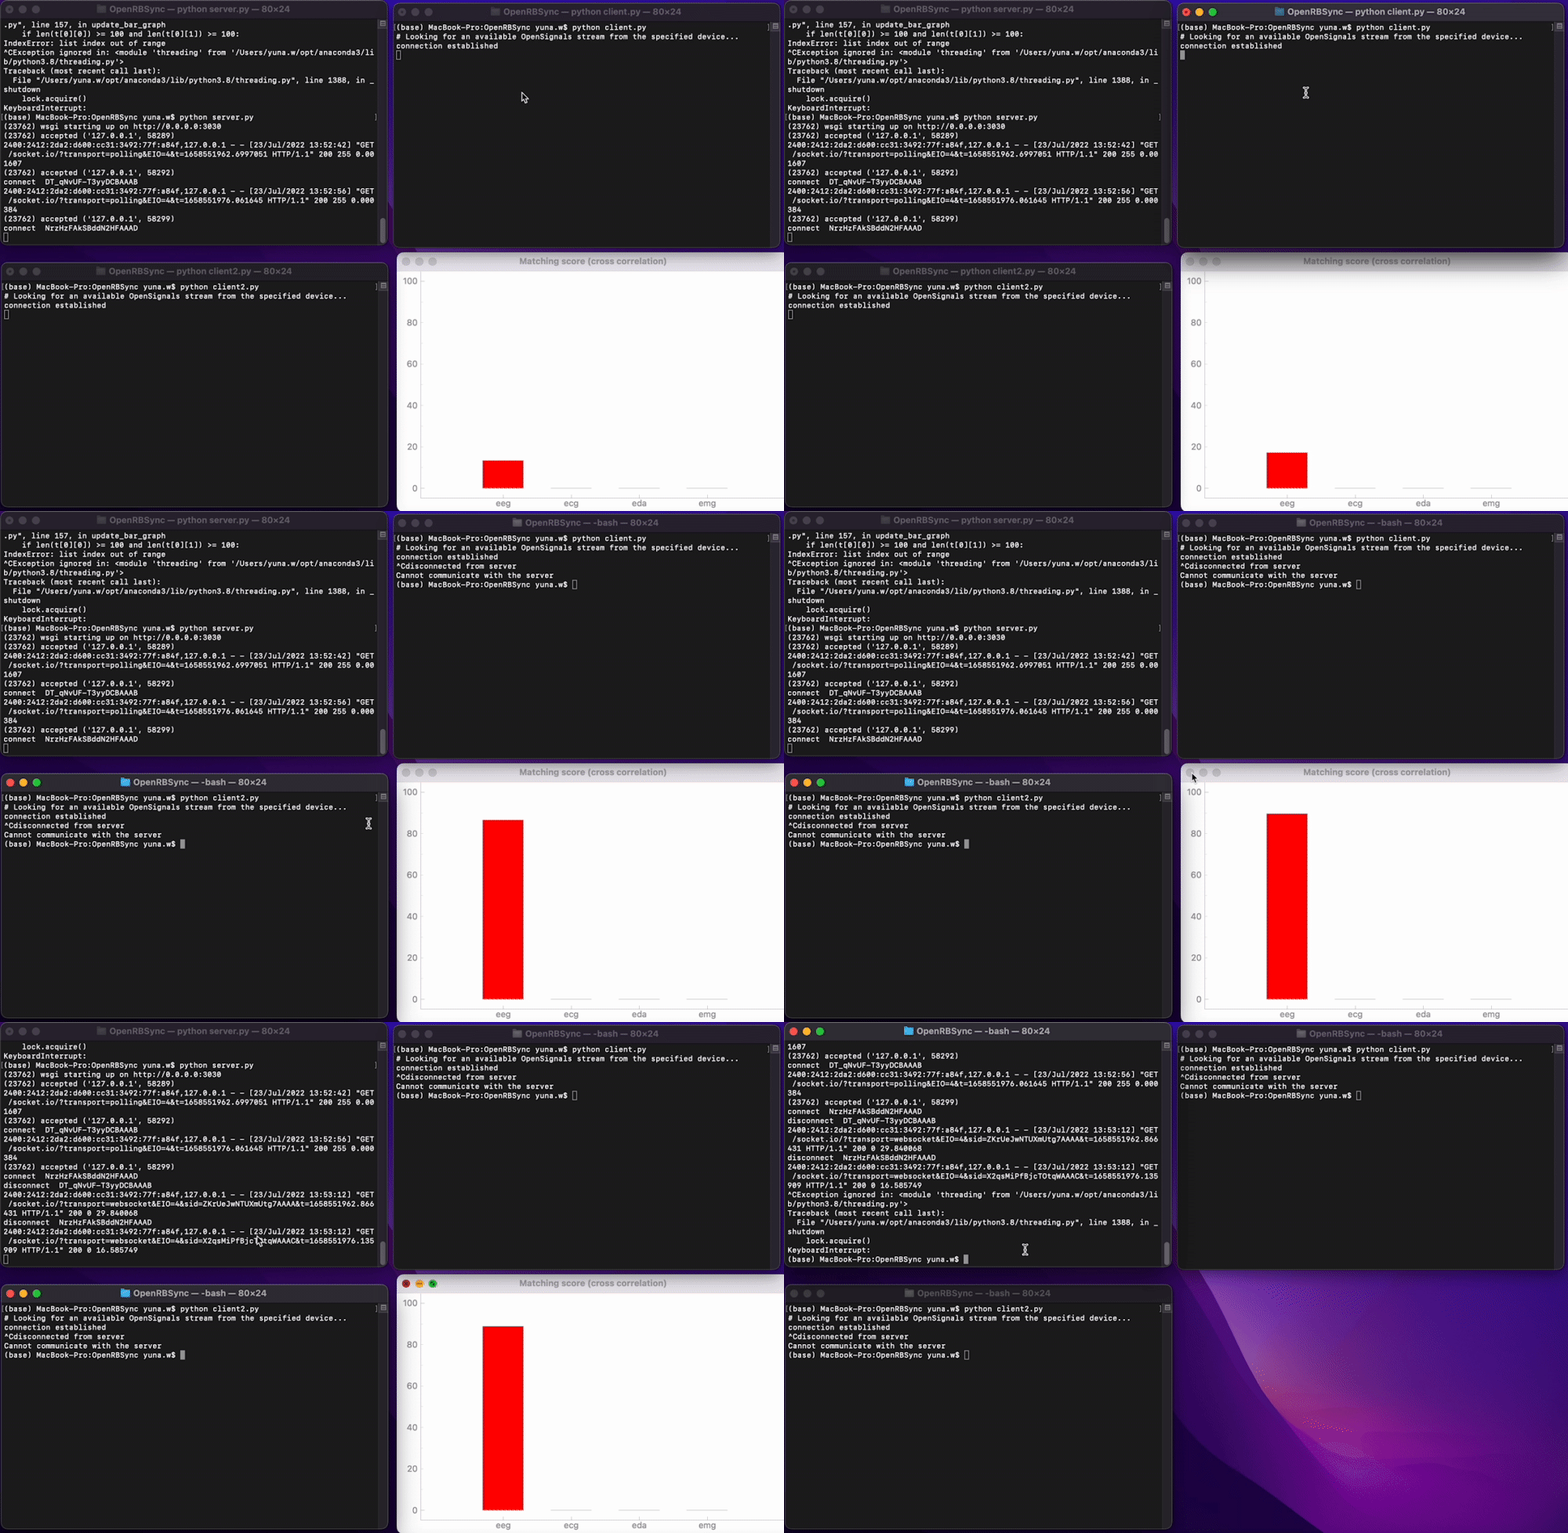
In a server PC, run server.py.
cd OpenRBSync
python server.py
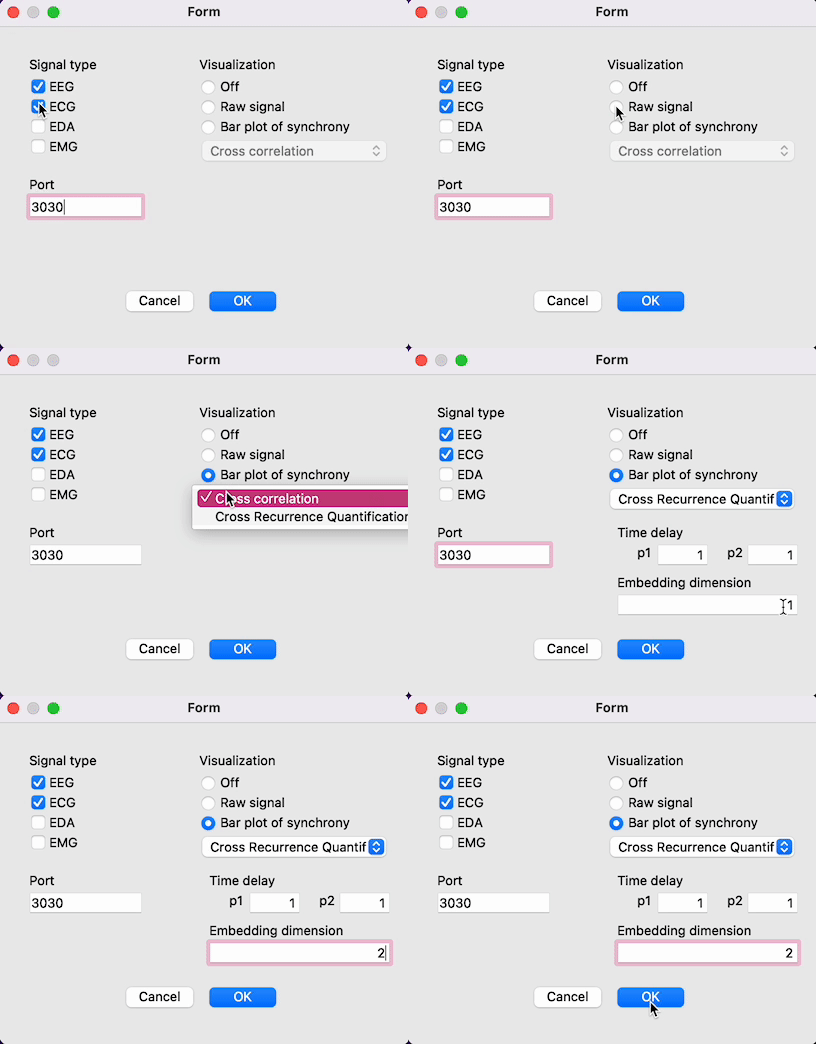
- In a GUI dialog, set appropriate parameters.
- Signals to receive from clients
- Port number to serve
- A Visualization method
- An analysis method
- Default parameters are set for port number and cross recurrence quantification analysis, but you can change them as you want.
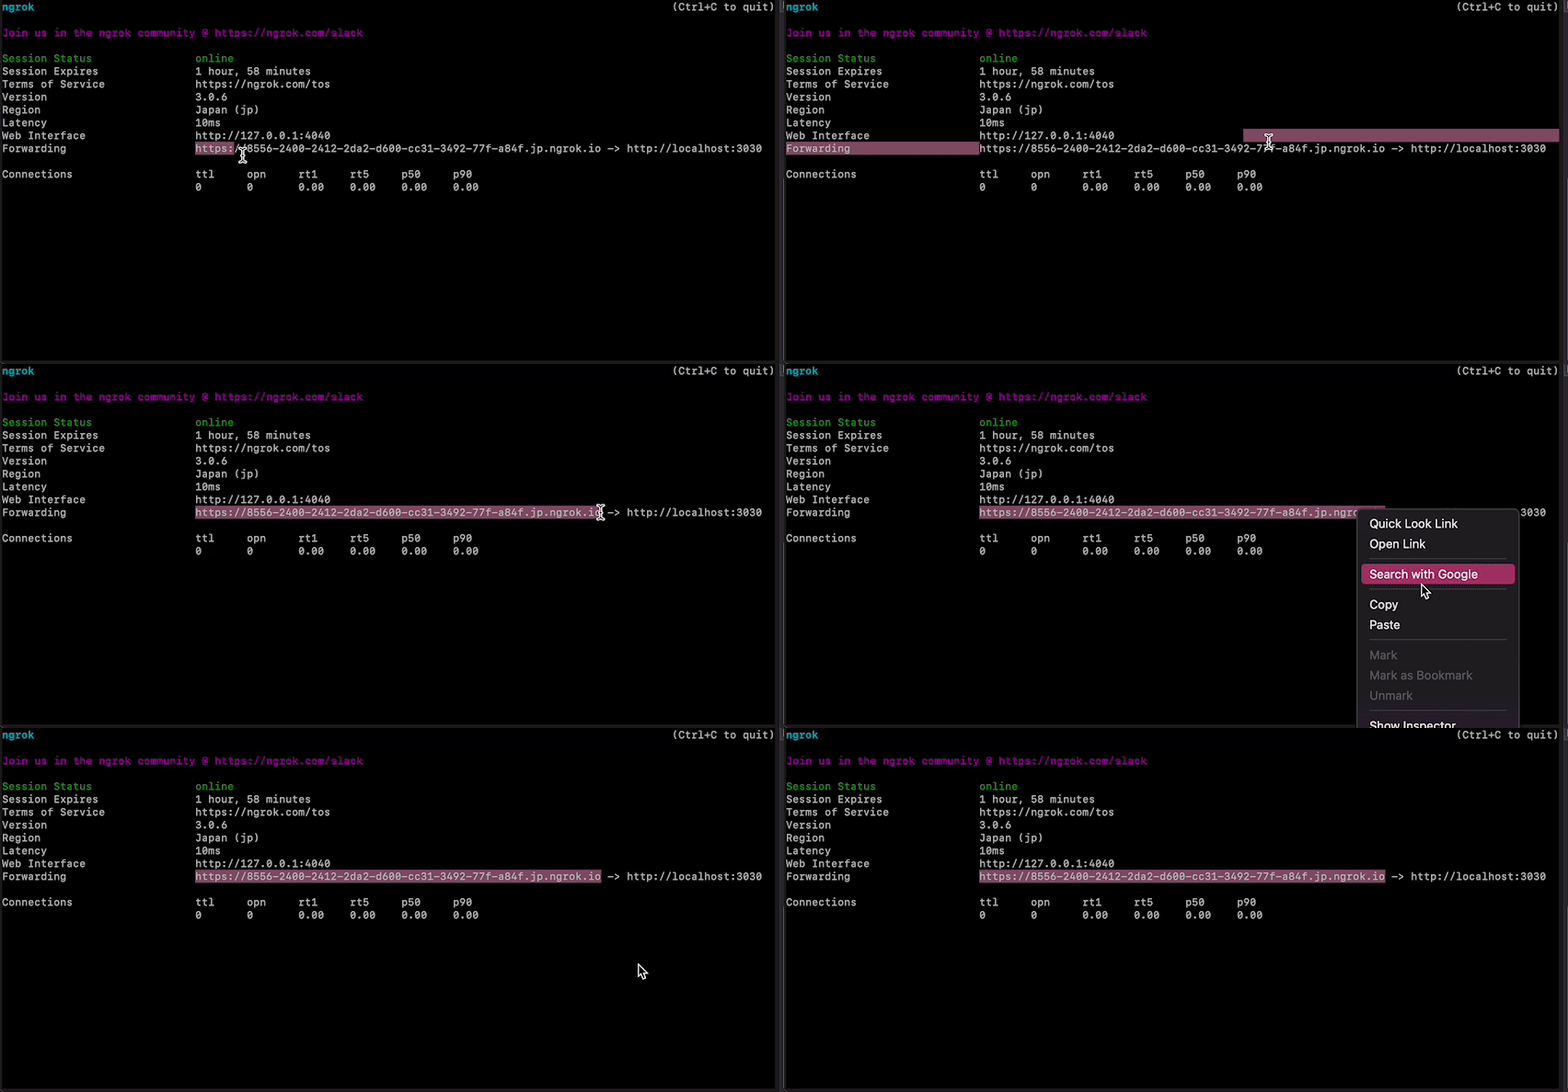
- Open another terminal window, and run ngrok command.
ngrok http [port number you set in the gui dialog (default is 3030)]
- Ngrok window will be showed up, so copy the link displayed. You should not close this ngrok window by the end of the data acquisition.
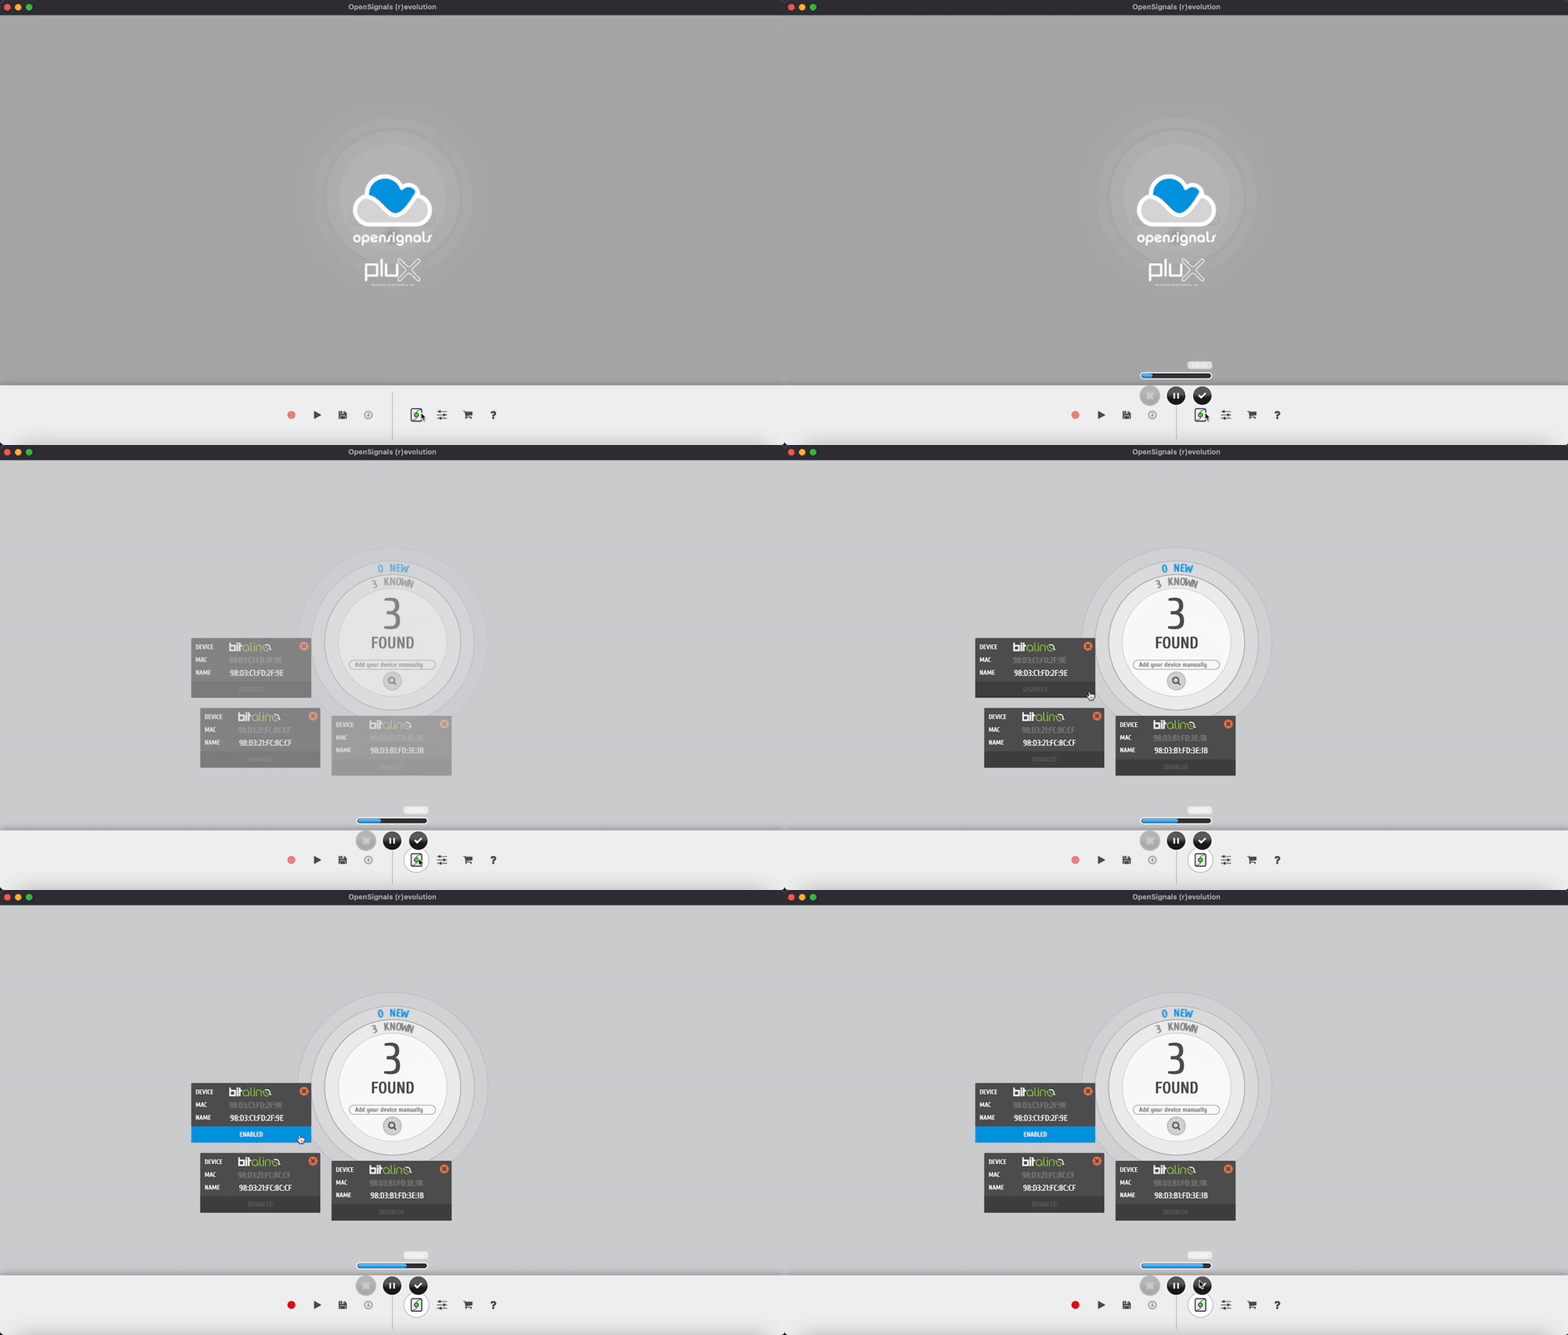
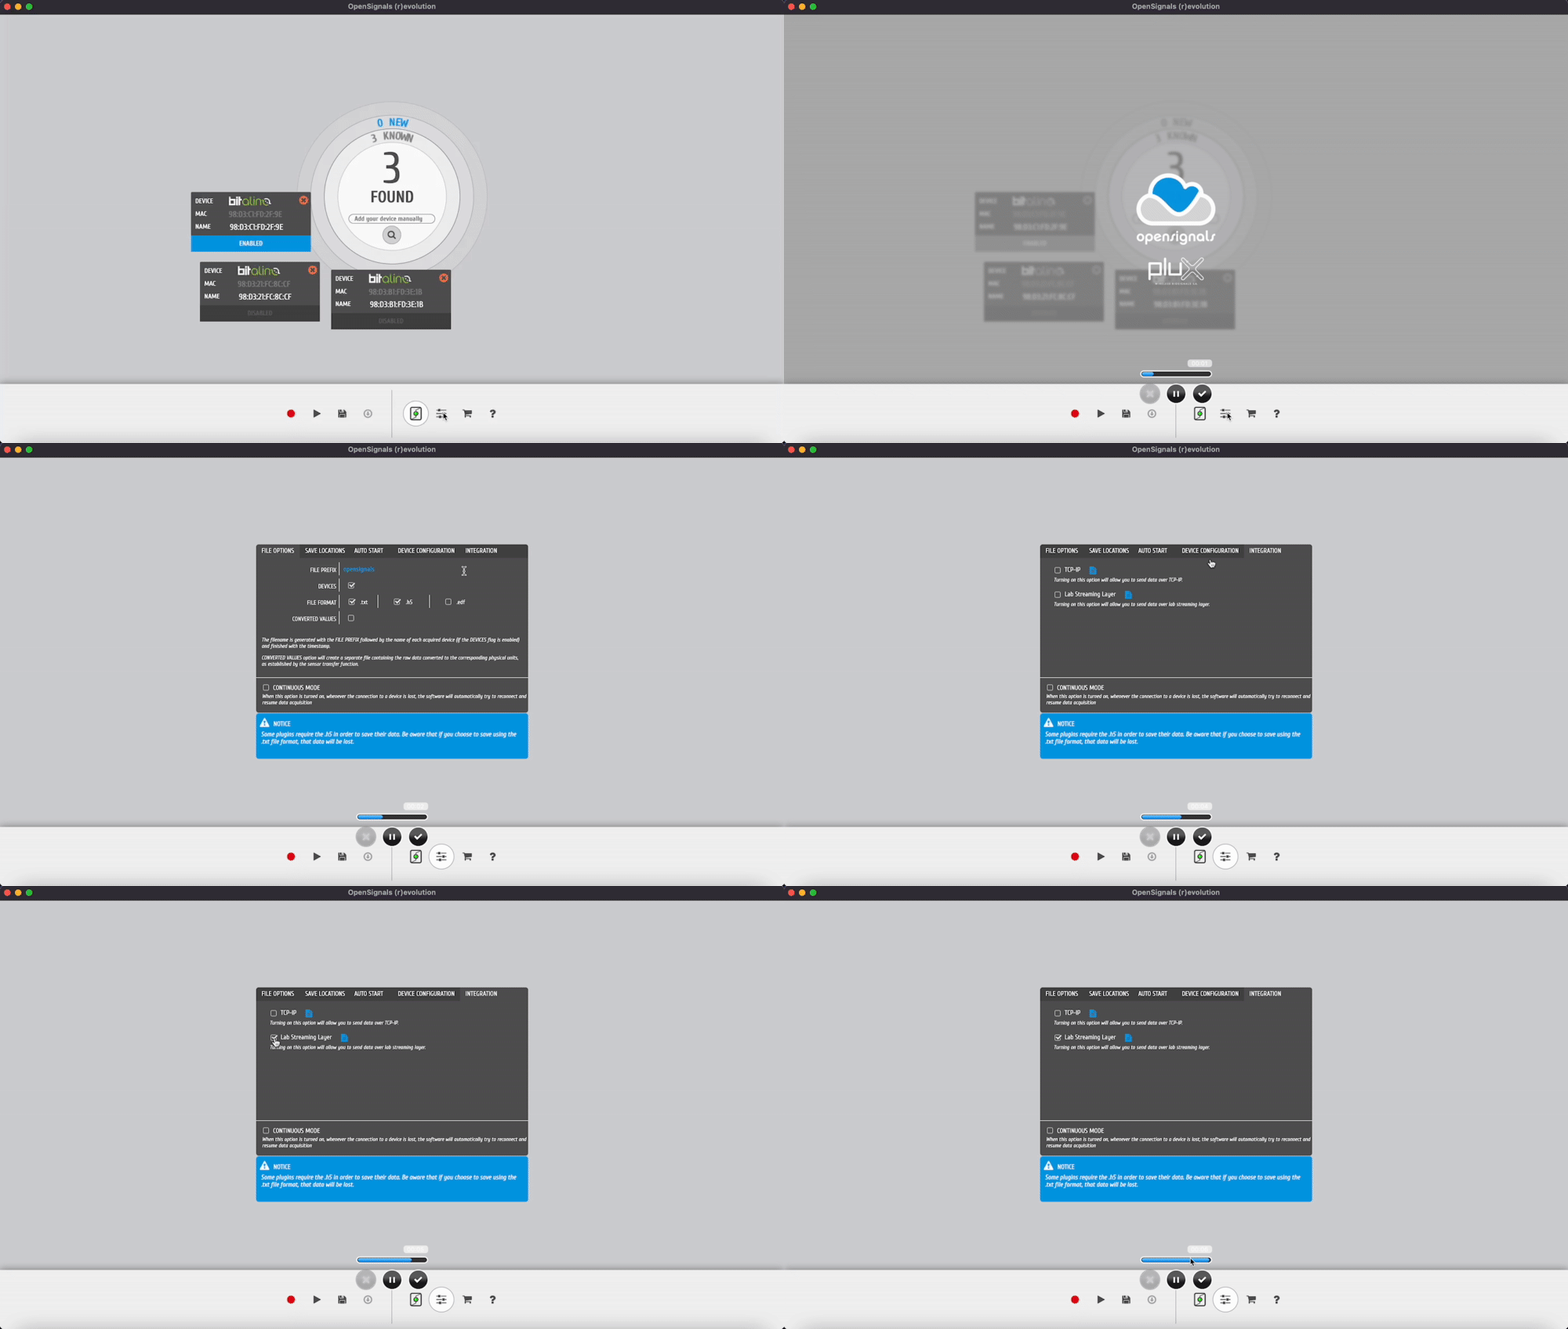
In each client PC, open OpenSignals and set up your BITalino.
-
Open System preferences of your computer, go to Bluetooth preference and connect your BITalino device via Bluetooth.
-
Launch OpenSignals, find your BITalino device, and enable it.
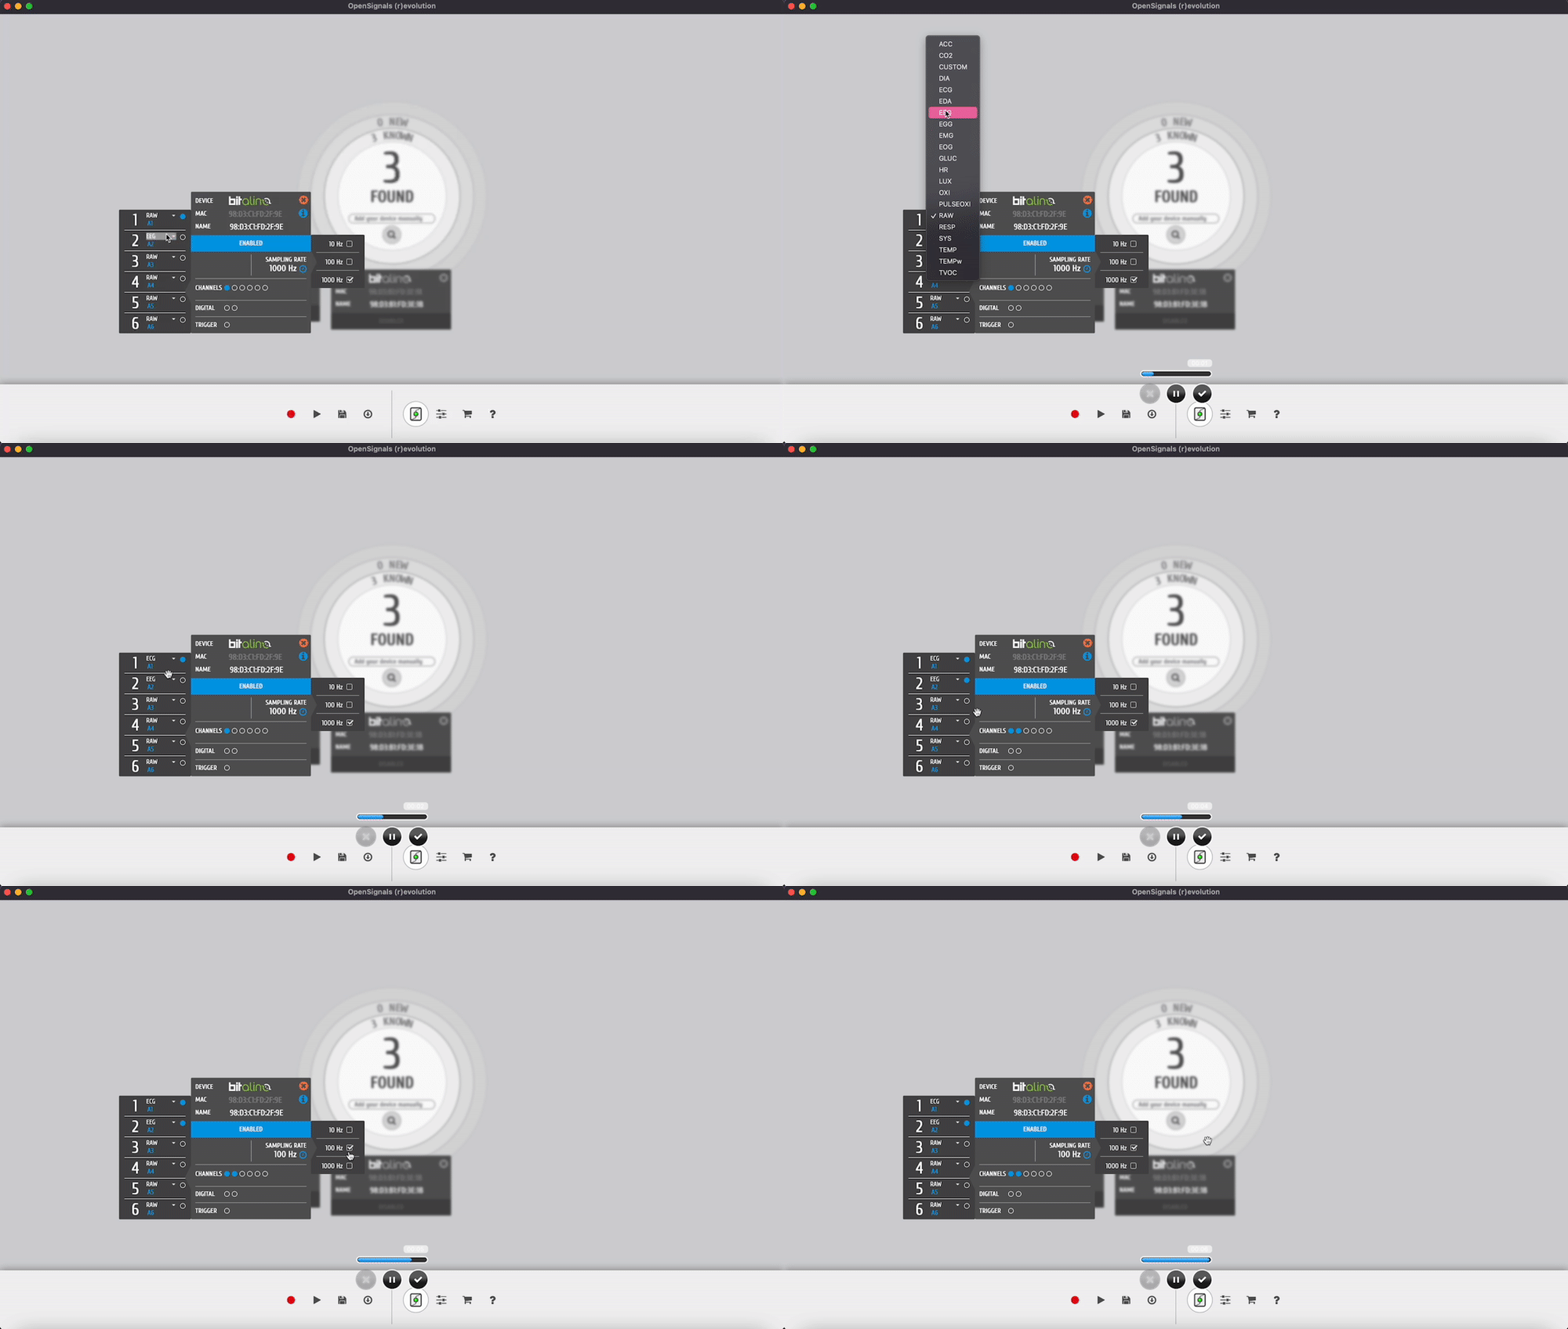
- Click on the box and configure parameters.
- Click on the setting icon, go to the INTEGRATION tab, and enable Lab Streaming Layer.
- Click the red button and start data acquisition.
Then, open terminal on your computer and run client.py.
python client.py
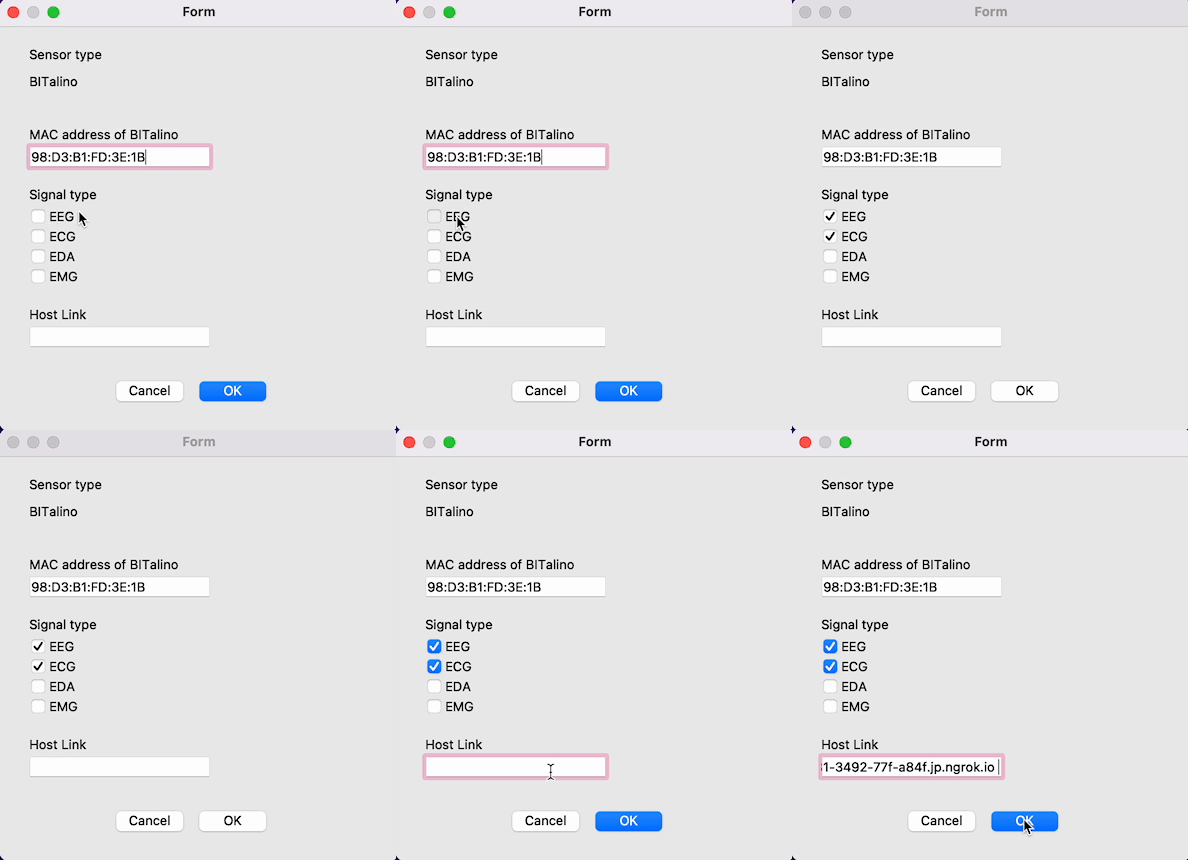
- In a GUI dialog, set appropriate parameters.
- MAC address of your BITalino device you have selected on OpenSignals. (Written in the back side of the device / OpenSignals)
- Signal types to send
- Host link you get by ngrok command on your server computer (Copy it from the row of Forwarding as shown in Running a server section.)
When you quit running programs, follow this order:
- Quit client.py and client2.py by entering ^C in the terminal window
- Click on the x button of the plotting window
- Quit server.py by entering ^C in the terminal window
Receive data from clients and visualize signals.
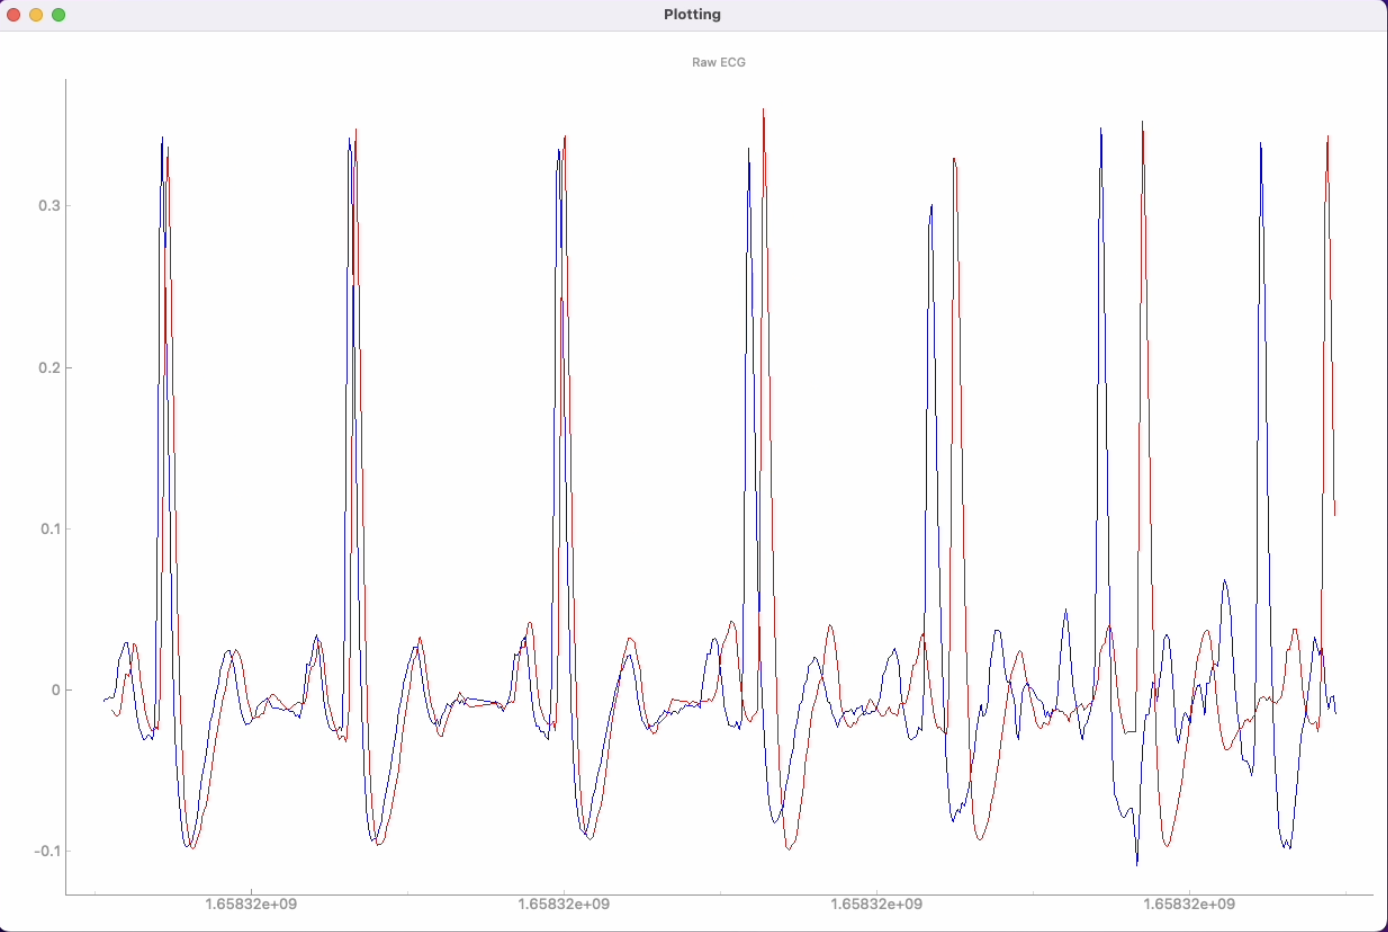
- Raw signal plot
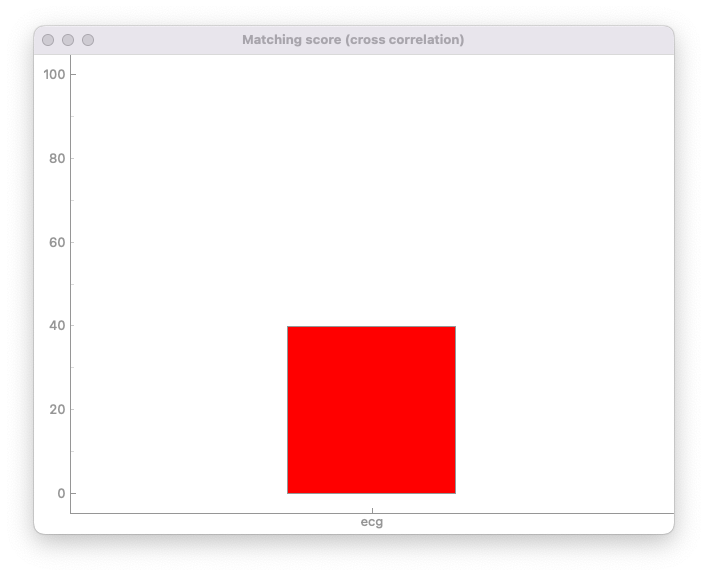
- Bar graph of synchronicity
- Calculate cross correlations of the past 500 signals and display the maximum correlation among time shifted correlations (multiplied by a hundred).
- Conduct Cross Recurrence Quantification Analysis and display recurrence rate multiplied by a hundred. Determinism is also saved in a csv file.
Receive data from sensors and send it to the server.
- bitalino (eeg, ecg, eda, emg)
Yuna Watanabe, Kotaro Omori (The University of Tokyo)
