Early this year, British and Brazilian presidents saw momentary increases in approval ratings ratings after being diagnosed with Covid-19. After US President Donald Trump announced he had contracted the virus following the first presidential debate, there were rumblings on the left that Trump was strategically manipulating American sentiment to avoid criticism from his bad debate performance. We set out to see if there was any merit to this claim and if it might have any outcome on the election.
The results of this Medium article suggest that "Twitter is becoming a more reliable platform to gather the true sentiment of a certain topic. Comparing sentiment of tweets to reliable polling data shows a correlation as high as 84% using a moving average smoothing technique", so we think tracking Twitter sentiment is an accurate gague of how the electorate is feeling.
"Did President Trump's positive COVID-19 test result in increased positive sentiment for himself and/or Joe Biden?"
Data Source: GitHub Repo link provided @12PM Friday 10/29/2020
-
Follow the instructions in the repository to install
twarcandtqdm. -
Apply for a twitter developer account.
-
Save api key, save api secret key, save bearer token.
-
Enter your twitter api information into twarc.
-
Use a
mvcommand to move the contents of the desired days into a new single directory. -
Look inside the cloned repository for the appropriate .txt files containing tweet ids. (ex.
cat * >> file name.txt) -
Concatenate those files into one file.
-
In the terminal, use
awk 'NR % 100 == 0' <file.txt> > <result.txt>to systematically sample every 100th tweet id. These are the tweets you will hydrate. -
Modify the
hydrate.pyscript in the cloned repository and run the script to rehydrate tweets from your file of tweet ids. -
Analyze tweets.
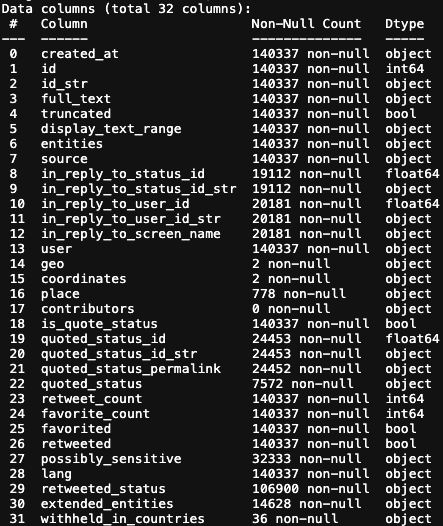
The full dataset we obtained consists of 140,337 tweets & metadata from 121,040 unique users. Twitter data is infamously messy, however for the purposes of this study, the issue is not as dramatic. We obtained a JSONL file consisting of 32 keys with only several columns providing use.
Since we wanted to make this a distinctly American study, we had to be as confident as possible in our dataset's sources. Our full cleaning process can be read in the src/load_clean_data.py file.The lang column was the easiest to start with, of which 16,082 non-English tweets were dropped.
The source column also showed potential problems. The bulk of the tweets came from The iPhone or Android Twitter apps, however many values looked like potential bots coming from 3rd party apps, so we dropped 1,456 tweets generated outside of the 5 most common sources officially integrated by Twitter.
The user column - a nested dictionary containing a location value - proved the trickiest to identify non-American tweets as Twitter does not enforce any standardization of profile info, leading joke values such as Planet Earth or multiple values for the same foreign city, (i.e. London, London, England, London, UK). We dropped 56,508 tweets based on this column.
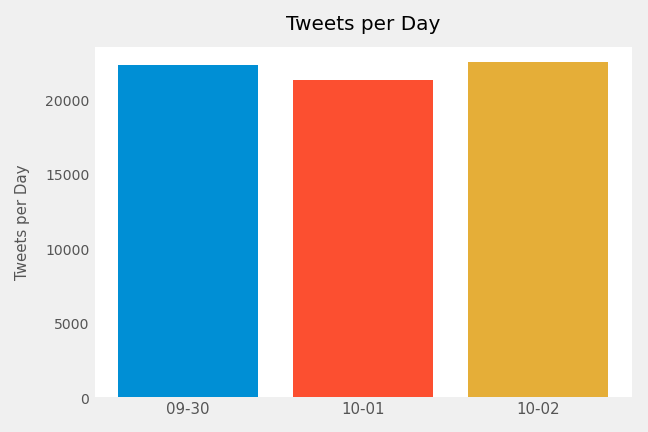
Our final dataset consists of 66,337 tweets, evenly distributed across each of the 3 days following the first Presidential Debate on September 29th.
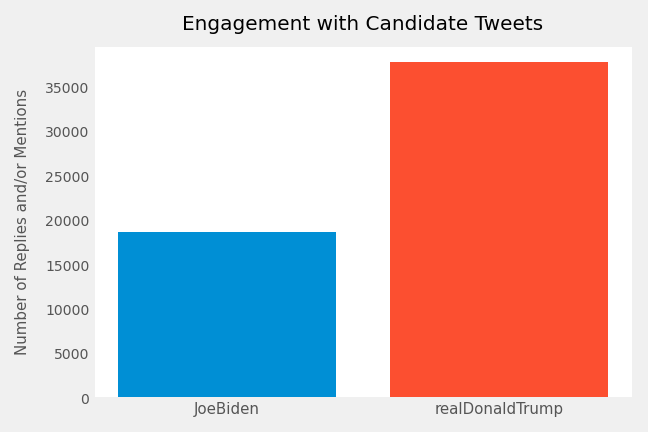
There is a strong presidential race theme in this dataset, with over half the tweets directly mentioning Trump while ~1/3 mention Biden. This did not surprise us as Trump is more active on Twitter.
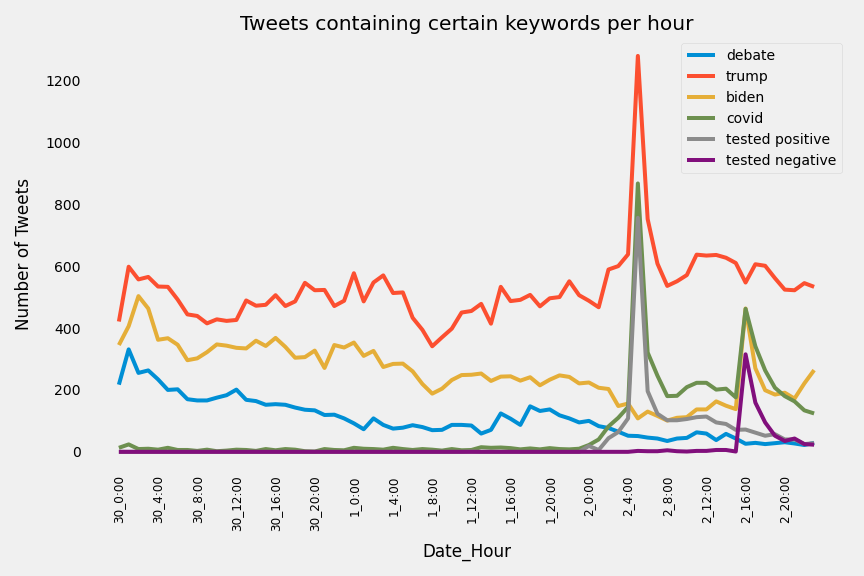
Something that sparked our interest was how quickly the 'Twittershpere' latched onto and then moved on from mentioning 'debate'. The early morning of the 30th (essentially late evening of the 29th) had around 300 tweets per hour mentioning the debate and stayed above 100 per hour the entire day, before dropping to 50 per and then close to 0 on the following. When President Trump tested positive for COVID-19 and Biden negative tested soon after, those topics took over the 'Twittershpere'
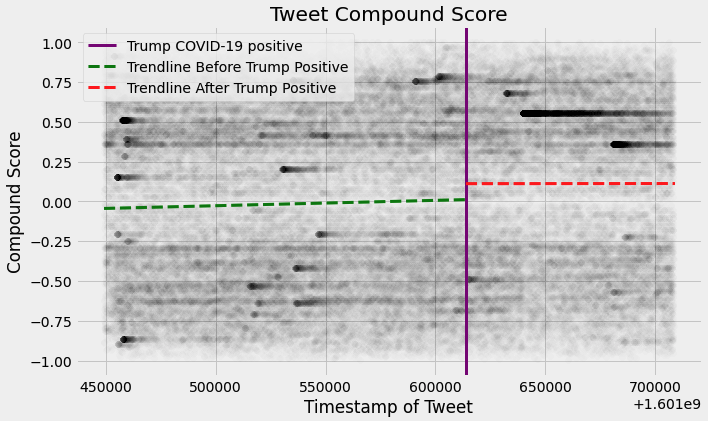
We wanted to assign a 'sentiment value' to each tweet in our dataset so we used the VADER sentiment library. This library reads in text and assigns it four scores: positivity, negativity, neutral, and compound, a measure of positive or negative excitement. To track sentiment over the three days of tweets in our dataset, we plotted every non zero compound score and created two trendlines: one for before President Trump tweeted about his positive COVID-19 test, and one for after. Below is the graph highlighting the change.
It appears that Trump's positive test resulted in a positive swing in sentiment for both Donald Trump and Joe Biden, but we were curious to see whether or not this change was significant.
We decided to conduct a series of hypothesis tests to determine the following:
- Whether or not Donald Trump's positive COVID test resulted in increased positive sentiment for himself and Joe Biden
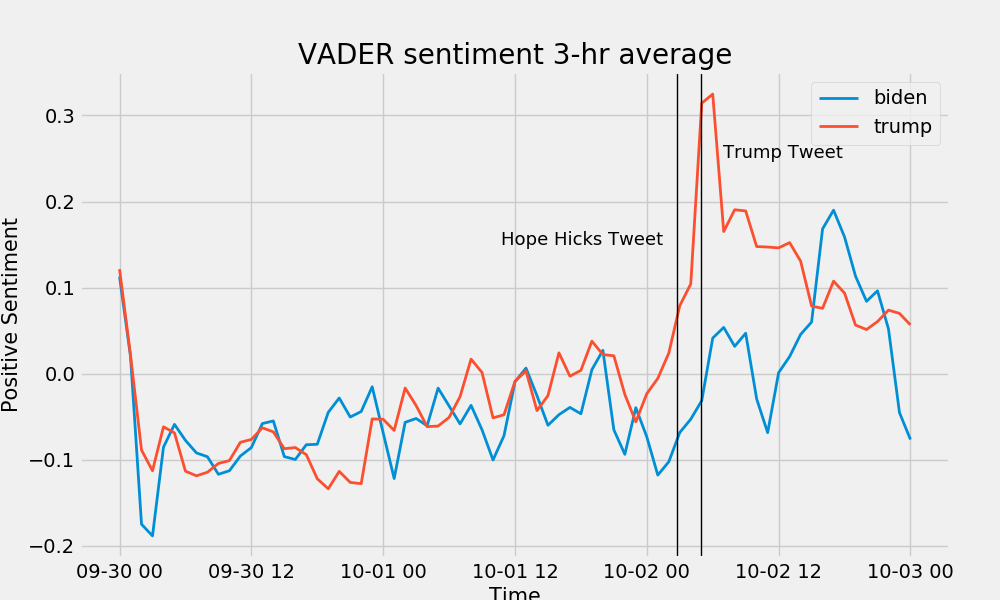
We were curious to know if the positive increases in sentment towards both candidates following Donald Trump's positive COVID-19 could be attributed to that. We created two hypothesis tests to determine this. Instead of using the moment at which Donald Trump announced that he had COVID-19 via Twitter, we chose to use his tweet announcing that Hope Hicks had COVID from several hours before as the break point.
Our reasoning behind this choice is that this is the point at which the possibility that Donald Trump had COVID-19 became real, given that he traveled with Hope Hicks daily in the days leading up to the test. It was after this point that the Twittersphere began to contend with this possibility, and we feel like the excitement we see in the graph surrounding the possibility of Donald Trump having COVID-19 matches the excitement we see in the graph following his confirmation.
Our formal question is as follows: Did the news of Hope Hicks' and Donald Trump's positive tests increase positive sentiment for Donald Trump and Joe Biden on Twitter?
Where b is before the Hope Hicks positive tweet and a is after. We ran identical experiments for four corpus's of tweets, with the followng criteria:
- Corpus 1: Exclusively Biden focused
- Corpus 2: Exclusively Trump focused
- Corpus 3: Biden focused but may include Trump
- Corpus 4: Trump focused but may include Biden
Sample Sizes:
| Grouping | Before Size | After Size |
|---|---|---|
| Only Biden | 6911 | 1821 |
| Only Trump | 15227 | 9691 |
| Biden | 11226 | 2799 |
| Trump | 19542 | 10669 |
Sentiment Swings:
| Candidate | Before Sentiment (avg) | After Sentiment (avg) |
|---|---|---|
| Only Biden | -0.02 | 0.11 |
| Only Trump | -0.03 | 0.16 |
| Biden | -0.07 | 0.07 |
| Trump | -0.05 | 0.15 |
Results:
| Grouping | p-value |
|---|---|
| Only Biden | 0.00 |
| Only Trump | 0.00 |
| Biden | 0.00 |
| Trump | 0.00 |
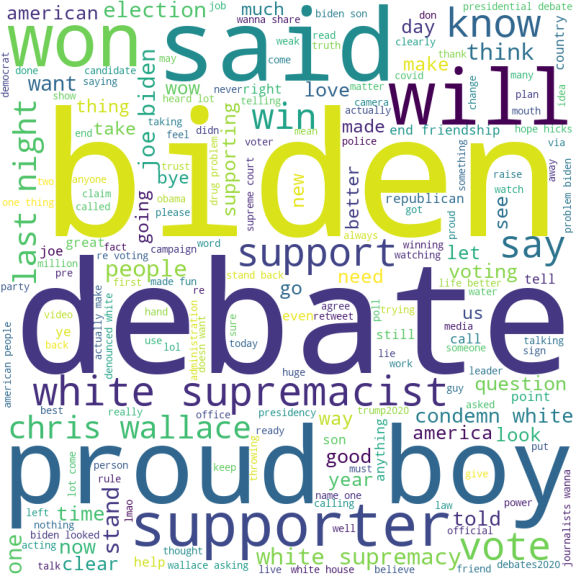
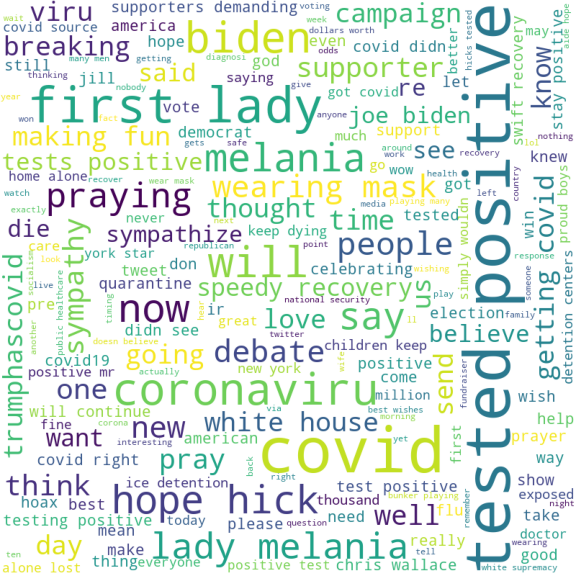
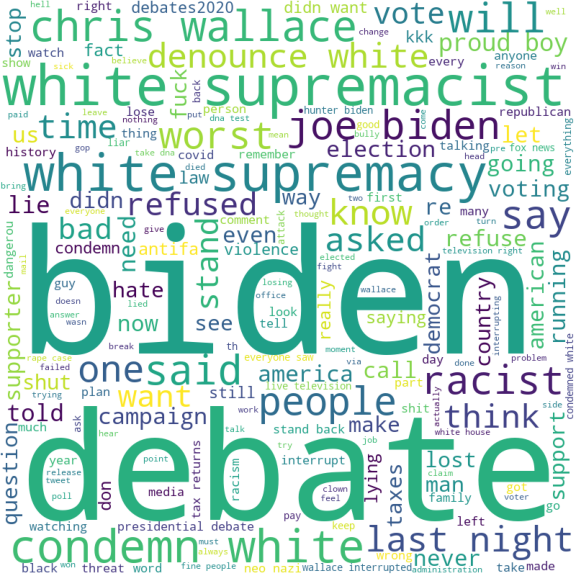
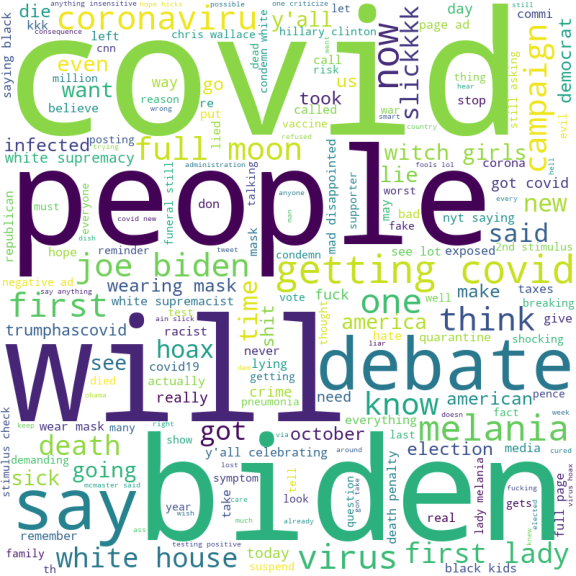
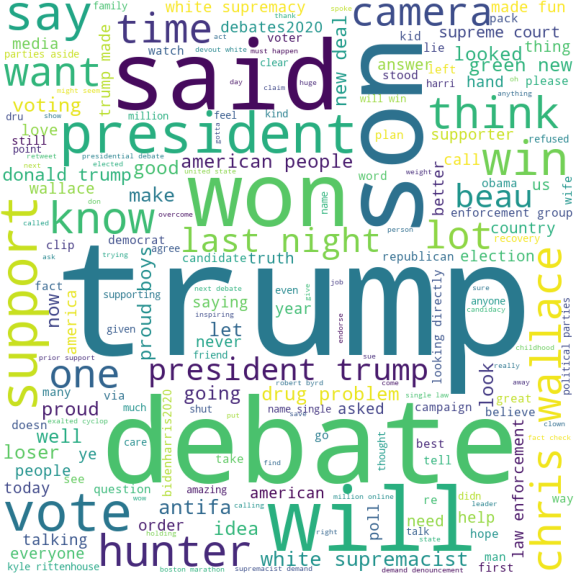
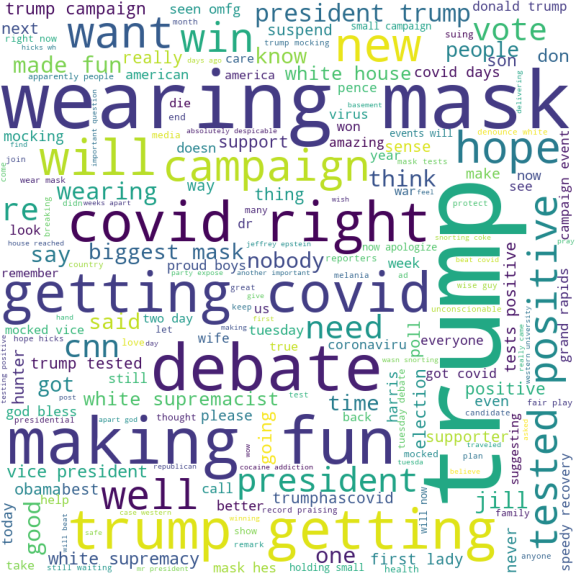
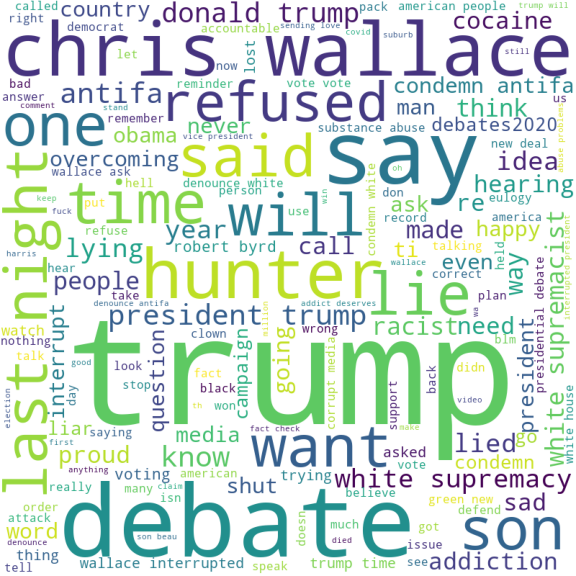
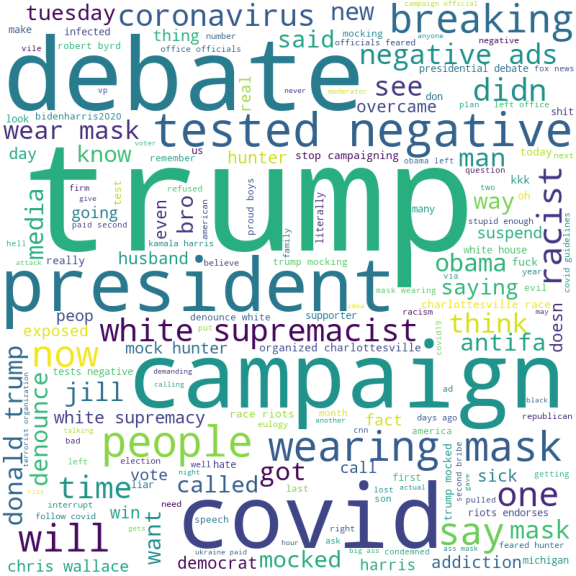
To better understand the context of American sentiment around this 3-day window, we mapped the sentiment scores onto the dataset and grouped tweets above and below the 0.0 compound threshold, before and after Trump's Covid diagnosis announcement for each candidate. Some interesting points to note:
- Positive sentiment towards both candidates is coupled with negative sentiment towards the other.
- The overlapping vocabulary between positive/negative sentiment might suggest the model does a good job of identifying language nuances, however more investigation is needed.
- The anti-Trump camp seems to relish Trump's diagnosis.
- Negative Biden tweets are muddied due to folks discussing his negative diagnosis, meaning true sentiment towards Biden may have been a bit higher.
Our null and alternate hypotheses were as follows:
Ho = The news of Hope Hicks' and Donald Trump's positive tests did not result in a positive change in sentiment for Donald Trump and Joe Biden on Twitter
Ha = The news of Hope Hicks' and Donald Trump's positive tests did result in a positive change in sentiment for Donald Trump and Joe Biden on Twitter
Ultimately, we did not reject our null hypothesis. Upon examining the data more closely following our experiment, we became less confident in our results. While there is an obvious positive spike for both candidates following the Hope Hicks tweet, we believe that this is not the result of increased support. Negative tweets were still occurring, they were just overshadowed by the existing supporters of each candidate becoming more vocal. Furthermore, some users expressed excitement that Donald Trump had COVID, which the VADER model would have interpreted as positive support.
Additionally, within hours of the events, the average sentiment lowered to similar levels prior to the COVID-19 debacle.
