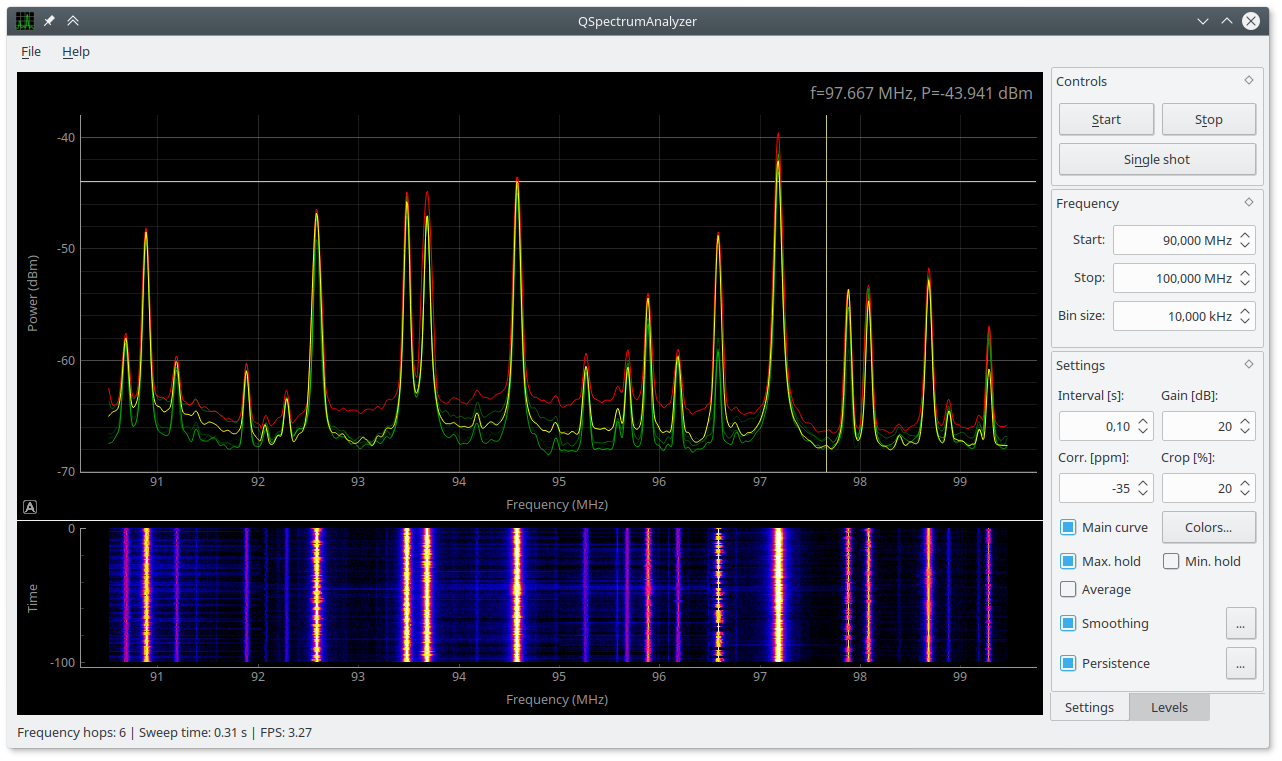
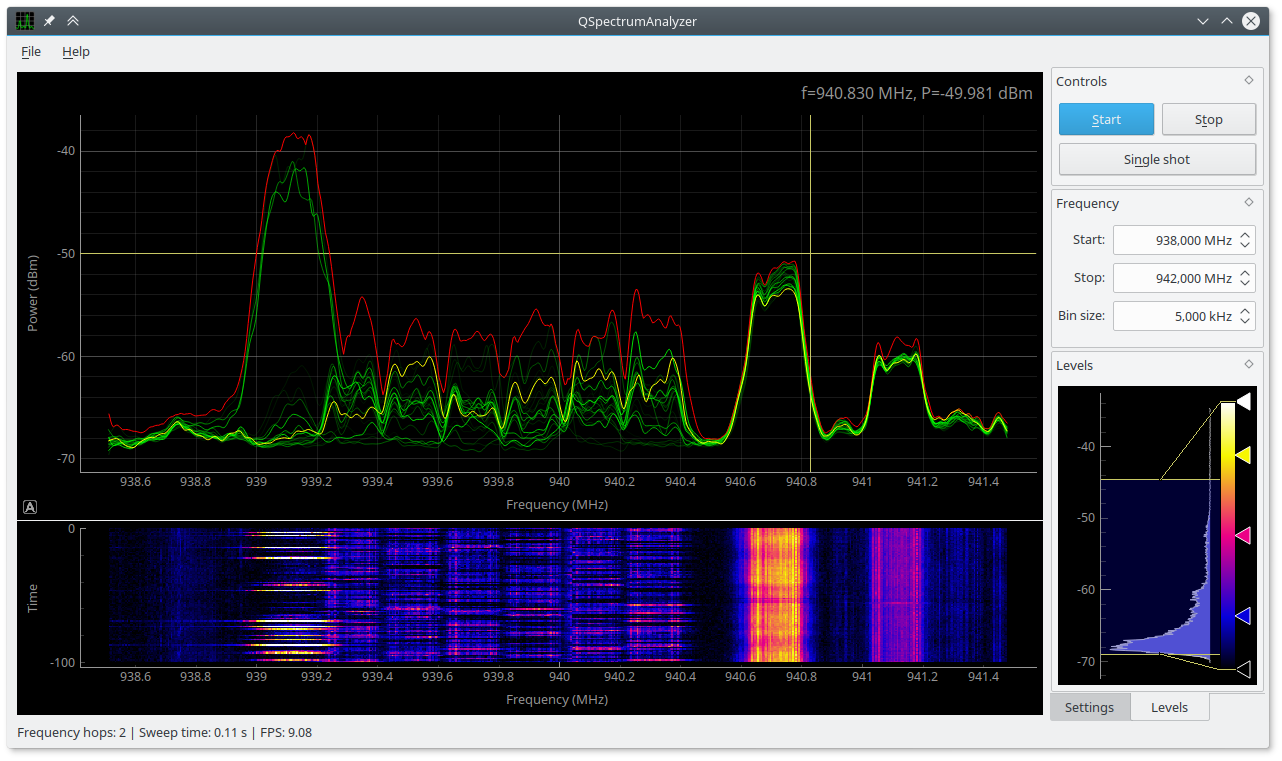
Spectrum analyzer for RTL-SDR (GUI for rtl_power based on PyQtGraph)
- Python >= 3.3
- PyQt >= 4.5
- PyQtGraph (http://www.pyqtgraph.org)
- rtl-sdr (https://github.com/keenerd/rtl-sdr)
- Optional: rtl_power_fftw (https://github.com/AD-Vega/rtl-power-fftw)
You should use Keenerds fork of rtl-sdr
(latest Git revision), because rtl_power in original rtl-sdr (from osmocom.org)
is broken (especially when used with cropping).
Another alternative is
rtl_power_fftw which has various
benefits over rtl_power. E.g. better FFT performance (thanks to
use of fftw library) and possibility to use much shorter acquisition time
for more real-time continuous measurement (minimum interval in original
rtl_power is 1 second, but in rtl_power_fftw you are only limited
by number of frequency hops).
Start QSpectrumAnalyzer by running qspectrumanalyzer.
You can choose if you want to use rtl_power or rtl_power_fftw backend in
File -> Settings (default is rtl_power). Path to rtl_power
(or rtl_power_fftw) executable can be also manually specified there. You can also
set waterfall plot history size in there. Default is 100 lines, be aware that
really large sweeps (with a lot of bins) would require a lot of system memory, so
don't make this number too big.
Controls should be intuitive, but if you want consistent results, you should turn off automatic gain control (set it to some fixed number) and also set crop to 20% or more. For finding out ppm correction factor for your rtl-sdr stick, use kalibrate-rtl.
You can move and zoom plot with mouse, change plot settings or export plots from right-click menu. Waterfall plot black/white levels and color lookup table can be changed in mini-histogram widget (on Levels tab).
Arch Linux:
git clone https://aur.archlinux.org/qspectrumanalyzer.git
cd qspectrumanalyzer
makepkg -sri
Or simply use pacaur (or any other AUR helper):
pacaur -S qspectrumanalyzer
Debian / Ubuntu:
sudo apt-get install python3-pip python3-pyqt4 python3-numpy
sudo pip3 install qspectrumanalyzer
Warning! pip will install packages system-wide by default, but you
should always use your distribution package manager for this.
You can install it locally only for your current user by running this (without sudo):
pip3 install --user qspectrumanalyzer
Executables will be then placed in ~/.local/bin directory, you can add it to your
PATH in ~/.bashrc.
- automatic peak detection / highlighting
- display average noise level
- frequency markers / bookmarks with notes (even importing / exporting .csv file with predefined channels, etc.)

