Skip to content

Latest commit


History

History
320 lines (298 loc) · 7.25 KB

README.md

File metadata and controls

320 lines (298 loc) · 7.25 KB

gravizo

How to include graphviz graphs in github README.md

Only need to include image markdown tag with the url http://g.gravizo.com/g? followed by your description graph in DOT syntax, UMLGraph, PlantUML or SVG :

![Alt text](http://g.gravizo.com/g? digraph G { aize ="4,4"; main [shape=box]; main -> parse [weight=8]; parse -> execute; main -> init [style=dotted]; main -> cleanup; execute -> { make_string; printf}; init -> make_string; edge [color=red]; main -> printf [style=bold,label="100 times"]; make_string [label="make a string"]; node [shape=box,style=filled,color=".7 .3 1.0"]; execute -> compare; } )

![Alt text](http://g.gravizo.com/g?
  digraph G {
    aize ="4,4";
    main [shape=box];
    main -> parse [weight=8];
    parse -> execute;
    main -> init [style=dotted];
    main -> cleanup;
    execute -> { make_string; printf};
    init -> make_string;
    edge [color=red];
    main -> printf [style=bold,label="100 times"];
    make_string [label="make a string"];
    node [shape=box,style=filled,color=".7 .3 1.0"];
    execute -> compare;
  }
)

This allow to include your graphs in the README, and still redeable in normal text editor.

SVG output it's ready. Only need to replace http://g.gravizo.com/g? by http://g.gravizo.com/svg? and http://g.gravizo.com/source? by http://g.gravizo.com/source/svg?

![Alt text](http://g.gravizo.com/svg? digraph G { aize ="4,4"; main [shape=box]; main -> parse [weight=8]; parse -> execute; main -> init [style=dotted]; main -> cleanup; execute -> { make_string; printf}; init -> make_string; edge [color=red]; main -> printf [style=bold,label="100 times"]; make_string [label="make a string"]; node [shape=box,style=filled,color=".7 .3 1.0"]; execute -> compare; } ) ###New. The indirect way.### You can use indirect way to refer a source file as graph description. Alt text

Use this sintax: ![Alt text](http://g.gravizo.com/source/<custom_mark>?<url_source_url_encoded>). And use html comments <!--- --> to hide the source.
![Alt text](http://g.gravizo.com/source/custom_mark?https%3A%2F%2Fraw.githubusercontent.com%2FTLmaK0%2Fgravizo%2Fmaster%2FREADME.md)
<!---
custom_mark
@startuml
object Object01
object Object02
object Object03
object Object04
object Object05
object Object06
object Object07
object Object08

Object01 <|-- Object02
Object03 *-- Object04
Object05 o-- "4" Object06
Object07 .. Object08 : some labels
@enduml
custom_mark
-->

Because limitations of the url you can use in direct way (not in indirect way) markdown, you should use the Converter to see more complex graphs:

![Alt text](https://g.gravizo.com/g? /** *Structural Things *@opt commentname *@note Notes can *be extended to span multiple lines / class Structural{} / *@opt all @note Class / class Counter extends Structural { static public int counter; public int getCounter%28%29; } / *@opt shape activeclass *@opt all *@note Active Class */ class RunningCounter extends Counter{} )

![Alt text](http://g.gravizo.com/g?
/**
*Structural Things
*@opt commentname
*@note Notes can
*be extended to
*span multiple lines
*/
class Structural{}
/**
*@opt all
*@note Class
*/
class Counter extends Structural {
        static public int counter;
        public int getCounter%28%29;
}
/**
*@opt shape activeclass
*@opt all
*@note Active Class
*/
class RunningCounter extends Counter{}
)

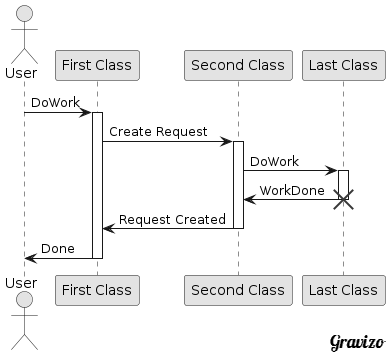
A sequence diagram. Note that you need to include ; in each new line:
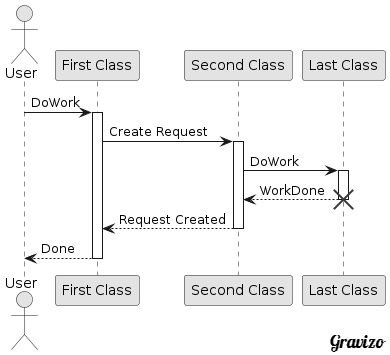
![Alt text](http://g.gravizo.com/g? @startuml; actor User; participant "First Class" as A; participant "Second Class" as B; participant "Last Class" as C; User -> A: DoWork; activate A; A -> B: Create Request; activate B; B -> C: DoWork; activate C; C --> B: WorkDone; destroy C; B --> A: Request Created; deactivate B; A --> User: Done; deactivate A; @enduml )

![Alt text](http://g.gravizo.com/g?
@startuml;
actor User;
participant "First Class" as A;
participant "Second Class" as B;
participant "Last Class" as C;
User -> A: DoWork;
activate A;
A -> B: Create Request;
activate B;
B -> C: DoWork;
activate C;
C --> B: WorkDone;
destroy C;
B --> A: Request Created;
deactivate B;
A --> User: Done;
deactivate A;
@enduml
)

An activity diagram. Note that you need to include ; in each new line:

![Alt text](http://g.gravizo.com/g? @startuml; %28*%29 --> if "Some Test" then; -->[true] "activity 1"; if "" then; -> "activity 3" as a3; else; if "Other test" then; -left-> "activity 5"; else; --> "activity 6"; endif; endif; else; ->[false] "activity 2"; endif; a3 --> if "last test" then; --> "activity 7"; else; -> "activity 8"; endif; @enduml )

![Alt text](http://g.gravizo.com/g?
@startuml;
%28*%29 --> if "Some Test" then;
  -->[true] "activity 1";
  if "" then;
    -> "activity 3" as a3;
  else;
    if "Other test" then;
      -left-> "activity 5";
    else;
      --> "activity 6";
    endif;
  endif;
else;
  ->[false] "activity 2";
endif;
a3 --> if "last test" then;
  --> "activity 7";
else;
  -> "activity 8";
endif;
@enduml
)

Now also suports SVG in JSON format:

![Alt text](http://g.gravizo.com/g? @gravizosvg {"svg": { "@height": "450", "@width": "450", "path": [ {"@id":"lineAB", "@d": "M 100 350 l 150 -300", "@stroke":"red"}, {"@id":"lineBC", "@d": "M 250 50 l 150 300", "@stroke":"red"}, {"@d":"M 100 350 q 150 -300 300 0", "@stroke":"blue", "@fill":"none"} ], "g": [ {"@stroke":"black", "circle":[
{"@id":"pointA", "@cx":"100", "@cy":"350", "@r":"3"}, {"@id":"pointB", "@cx":"250", "@cy":"50", "@r":"3"}, {"@id":"pointC", "@cx":"400", "@cy":"350", "@r":"3"} ]}, {"text": [ {"@x":"100", "@y":"350", "@dx":"-30", "$":"A"}, {"@x":"250", "@y":"50", "@dy":"-10", "$":"B"}, {"@x":"400", "@y":"350", "@dx":"30", "$":"C"} ]} ] } } )

![Alt text](http://g.gravizo.com/g?
@gravizosvg
{"svg": {
		"@height": "450",
		"@width": "450",
		"path": [
			{"@id":"lineAB", "@d": "M 100 350 l 150 -300", "@stroke":"red"},
			{"@id":"lineBC", "@d": "M 250 50 l 150 300", "@stroke":"red"},
			{"@d":"M 100 350 q 150 -300 300 0", "@stroke":"blue", "@fill":"none"}
    ],
		"g": [
			{"@stroke":"black", "circle":[  
				{"@id":"pointA", "@cx":"100", "@cy":"350", "@r":"3"},
				{"@id":"pointB", "@cx":"250", "@cy":"50", "@r":"3"},
				{"@id":"pointC", "@cx":"400", "@cy":"350", "@r":"3"}
			]},
			{"text": [
				{"@x":"100", "@y":"350", "@dx":"-30", "$":"A"},
				{"@x":"250", "@y":"50", "@dy":"-10", "$":"B"},
				{"@x":"400", "@y":"350", "@dx":"30", "$":"C"}
			]}
		]
	}
}
)