Name: Javier Fernandez
Semester: Spring 2019
Project area: Agronomy
Calculations of growing degree days (GDD) are important in models simulating crop growth. However, there is no clear indication of the relative precision of different thermal functions in simulating crop stages (Kumudini et al., 2014)
-
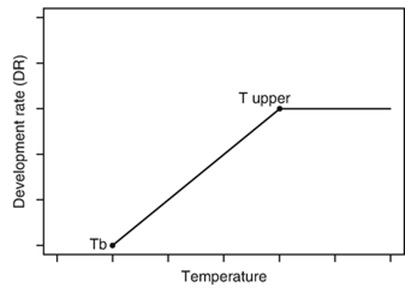
The most widely used approach, and often precise, is assuming a linear relationship on the rate with the temperature above a base temperature. It calculates the DTT (daily thermal time) using the average daily value.
-
A second method propose considering the alternation of diurnal and nightly temperatures by using the HTT (hourly thermal time).
where,
So far, for grain filling in maize it has not been thoroughly studied whether there is an improvement in models accuracy between these approaches.
I hope that this code will help me save time when searching for thermal time units (instead of doing it manually) for past and future experiments. The function will be used to retrieve GDD information from Ashland Bottoms Mesonet Station for 2017 and 2018 summer crop seasons. Specifically, it will be used during corn grain filling months, from June to September. In addition, in the future I might be able to quickly obtain data on multiple weather stations to extend my analysis to other locations through modelling.
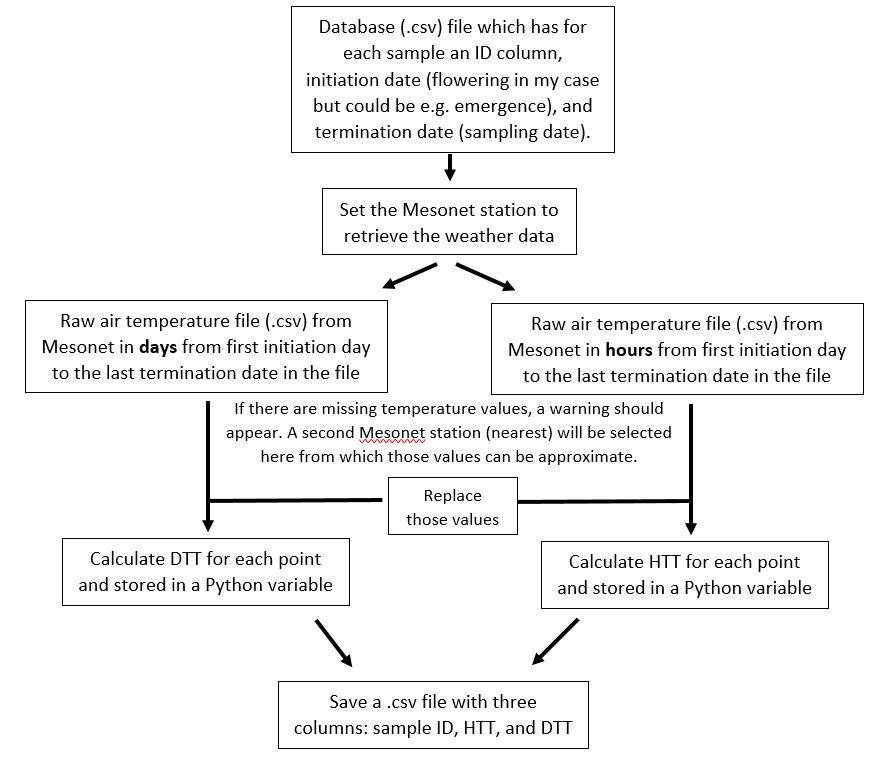
The objective is to create a code that can determine and calculate the HTT (Hourly Thermal Time) and DTT (Daily Thermal Time) using Kansas Mesonet database for grain filling samples. Periods of time for HTT and DTT calculations will be between a flowering date (starting point) and a sampling date for each data point.
Moreover, the code will allow the user to choose a minimum and maximum cardinal temperatures for calculations on HTT and DTT. This will be useful to evaluate and compare different base temperatures for grain filling.
The main outcome of this code should be a .csv file with three columns:
- An ID column identifying each sample (based on the input file with the data points and dates)
- A second and third columns with the calculated HTT and DTT respectively.
-
Bannayan, M., Hoogenboom, G., & Crout, N. M. J. (2004). Photothermal impact on maize performance: a simulation approach. Ecological Modelling, 180(2-3), 277-290.
-
Kumudini, S., Andrade, F. H., Boote, K. J., Brown, G. A., Dzotsi, K. A., Edmeades, G. O., ... & Hatfield, J. L. (2014). Predicting maize phenology: intercomparison of functions for developmental response to temperature. Agronomy Journal, 106(6), 2087-2097.
-
McMaster, G. S., & Wilhelm, W. W. (1997). Growing degree-days: one equation, two interpretations. Agricultural and forest meteorology, 87(4), 291-300.
-
McMaster G.S., Moragues M. (2018) Crop Development Related to Temperature and Photoperiod. In: Meyers R. (eds) Encyclopedia of Sustainability Science and Technology. Springer, New York, NY
-
Zhou, G., & Wang, Q. (2018). A new nonlinear method for calculating growing degree days. Scientific reports, 8(1), 10149.
-
Kansas Mesonet, 2017: Kansas Mesonet Historical Data. Accessed 10 April 2019, http://mesonet.k-state.edu/weather/historical

