Display Lipid data of Rat
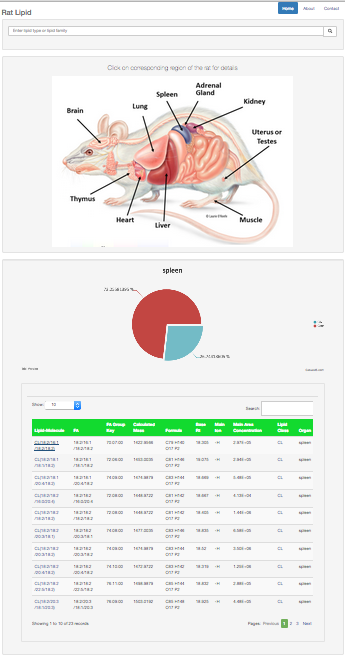
Visualize rat's organ research lipid data.
A picture is worth a thousand words:
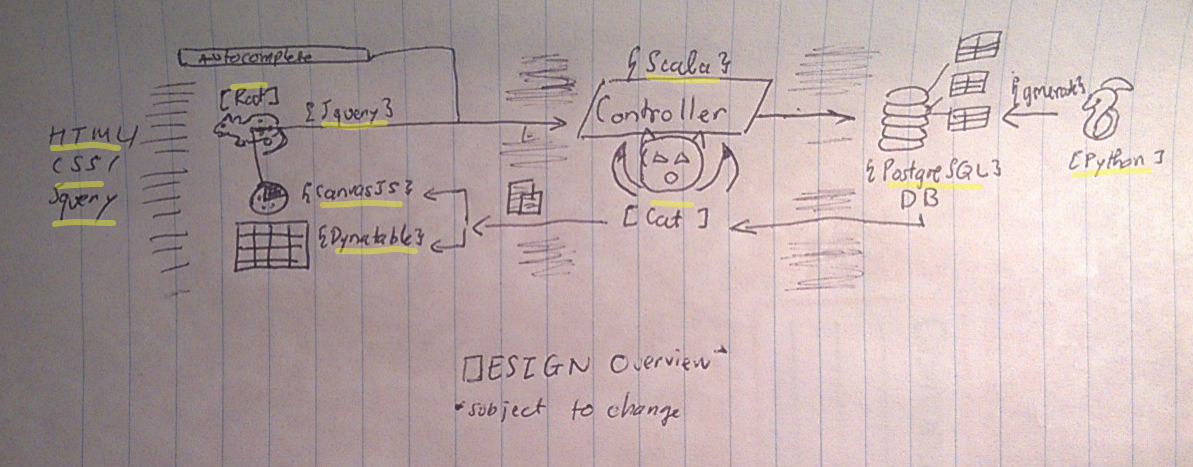
Techs used: HTML/CSS/Jquery/Bootstrap/CanvasJS/Dynatable,PostgreSQL,Scala,Python
Website bundle consists of two main layers:
-
Front-end: Set up interface and send request to back end for data
-
HTML/CSS/Jquery/Bootstrap: web layout.
-
CanvasJS: percents in chart(pie,bar).
-
Dynatable: display lipid molecule data as table.
-
-
Back-end: Process request from front end [Play framework]
- PostgreSQL (v.9.5): Database- Store lipid data.
- Scala: interact with the database(Postgre) and return data to front end.
-
No-end: Scripts and tool
-
Python script[sql_gen.py]: to automatically insert data( from csv ) into the database.
-
GIMP: generate click area for each rat organ.
-


