Simple python module to monitor a Netgear CM1150V Cable Modem. They may or may not work for other Cable Modems although it's designed to be relatively extendable.
Bottom Line Up Front, the installation information below has pretty much everything you need to set this up on a linux (and maybe windows) host and generate pretty html about the state of your cable service over time. If you can't stand seeing the sausage get made, you may want to avoid the rest
Comments and improvements are most welcome, but it's doubtful I'll spend much more time on this unless circumstances change.
If you have a compatible modem you can query it and display the results with ModemCheck.py and ModemDisplay.py fire them up with --help for some basic command line help.
Things you may not already have in your python implemenation that you'll need. You can pip install plotly, pandas and pytimeparse but at least on Fedora Linux you can use the system package management as well.
- plotly - which requires a lot of prequisites. This is needed by
ModemDisplay and pytimeparse which is needed for some deltatime
manipulation. On Fedora 37 I simply used
dnf install python3-plotly python3-pytimeparse
Steps that work for Linux Fedora 37. Other systems may vary.
mkdir /usr/local/lib/ModemCheck/andmkdir /var/log/ModemCheck/cp ModemCheck.py /usr/local/lib/ModemCheck/- Create a file
/usr/local/lib/ModemCheck/ModemPasswordcontainnig the password to the modem. Make sure permissions are restrictive withchmod 700 /usr/local/lib/ModemCheck/ModemPassword cp ModemCheck.service /etc/systemd/system/cp modemcheck.rotate /etc/logrotate.d/modemchecksystemctl enable ModemChecksystemctl start ModemCheck- Diplay the results. Something like the below cron entry can be used to periodically updat the results somewhere.
06 */2 * * * /usr/local/lib/ModemCheck/ModemDisplay.py -d /var/log/ModemCheck/ModemData.json -o /var/log/ModemCheck/ModemData.html && rsync /var/log/ModemCheck/ModemData.html /var/log/ModemCheck/plotly.min.js [email protected]:secure_html/ModemCheck/ && rm -f /var/log/ModemCheck/*.{html,js}- You'll need the plotly javascript code to include in the directly with the html output (or modify ModemDisplay.py to use the cdn version if you want. See plotly download.
I have a Netgear CM1150V Cable Modem on the Comcast - or Xfinity, or whatever the monopolistic entity is calling itself today - network. It's been a bumpy ride. Leaving for another time the stories (yes, more than one) of Comcast installation fails, today I'll describe a seemingly simple problem with a less than simple solution. Because, well, things...
So my cable service had been sketchy for a while, but then something happened. Right when I was thinking my service was so crappy that it was time to bite the bullet and call Comcast service, it got better. Not just a little better. Television pixelated far less; Internet seemed snappier; and most reassuring from an objective point of view, the statistics on my cable modem's downstream channel bonding were orders of magnitude better. Signal to noise ratios (SNR) went from just barely acceptable to great. The same with power levels. And packet errors dropped to zero - absolute zero - for weeks at a time. But, alas, it was too good to last. SNR and power are still acceptable, but not what they were. There are increasely disturbing numbers of packet errors particularly on one frequency. Unfortunately, the CM1150V only reports those as number of correctable and uncorrectable errors on each frequency since the modem last booted. That's not really helpfull for registering complaints with Comcast, who I'm sure will be anxious to "close" intermittent issues as resolved without investigation.
Overall I've been pleased with the CM1150V. It's triple-play voice feature works (but only with Comcast.) After some poking around I've discovered that both voice ports (RJ11 jacks) on the modem are active and that one has precedence; picking up that line will disconnect the other line. A perfect setup for connecting the alarm system. I have have 1,200 Mb/s cable service. The modem will support multi-gig and has LAGG ports to support multiple bonded 1 Gb/s connections. I enabled the LAGG ports to my OPNsense firewall. That resulted in connection speeds that would drop percipitiously after a day or so. After far too much troubleshooting I discoverd it was a known, but obscure, issue with the LAGG ports. For more see here Netgear had reportedly fixed that issue, but, in true Comcast fashion, they hadn't pushed the updated firmware to the modems. After more than a year. I was finally able to convice a tier 1 tech that despite him "knowing" from his "years" of experience, that upgrading cable modem firmware was a customer responsibility, that in fact the DOCSIS standard requires that it only be done from the CMTS (i.e., Comcast) and got him to escalate it to tier 2. A couple days later my firmware version magically went from V2.02.04 to V4.12.04 and the speed issues, as expected, resolved. Despite being "customer owned" the cable modem is still completely controlled by the cable company. All this just to provide some background that maybe I should have expected this journey to be less straightforward than expected.
I have, from time to time, participated in teaching a Python class for beginners. It's mostly geared toward getting people to the point where they can build some useful scripts for themselves. It is not CompSci 101. But it seemed like this would be a good example to have laying around of how scratching your own itch with your own script works. Fortunately or unfortunately, it turned out to be a really excellent example of how iterative this is in practice.
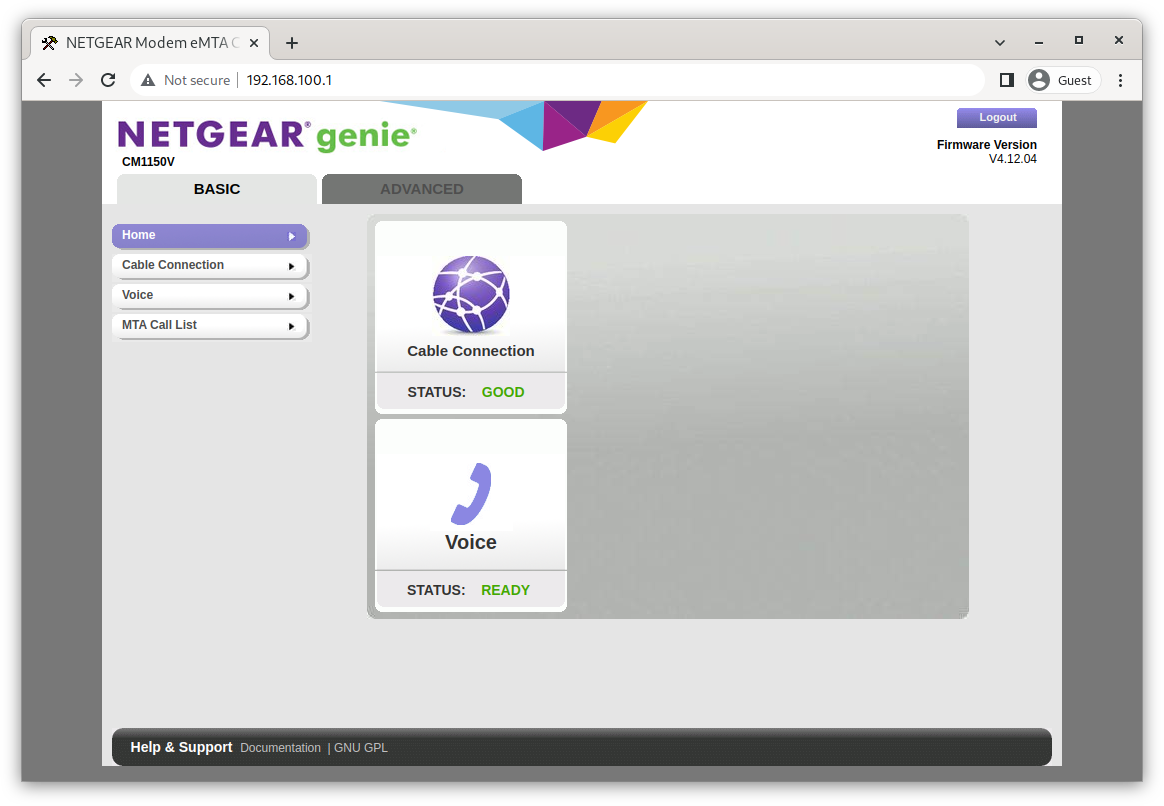
So, aim your broswer at 192.168.100.1, authenticate to the modem, and a "basic" configuration page is shown.
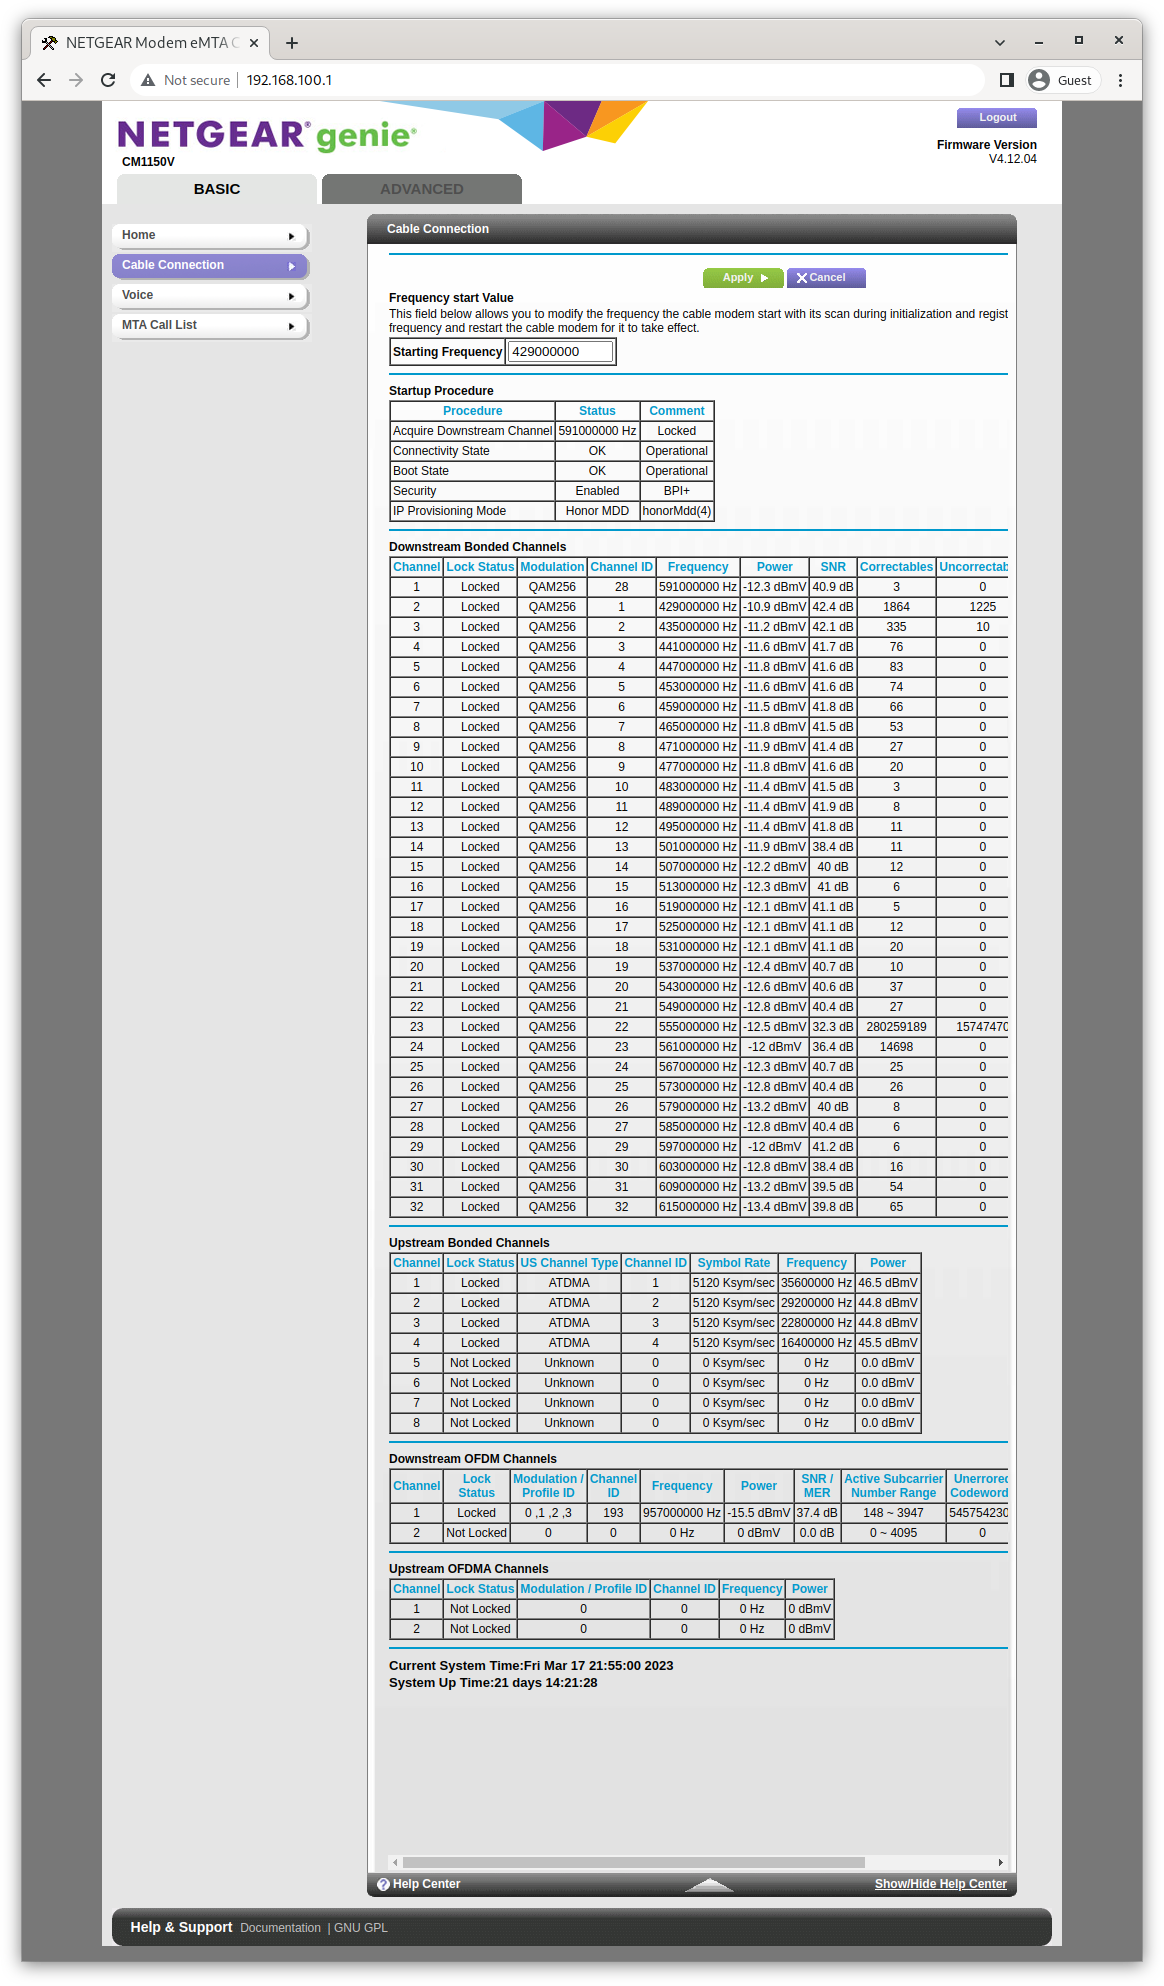
Click on the "Cable Connection" and a useful page of statistics is presented. Assuming you only care about the current signal parameters and the total packet errors since the modem last booted.
The data seems to be in a bunch of HTML tables. It seemed like it would be an excellent example of straightforward HTML scraping. We'll fire up Python with some BeautifulSoup and be done in a flash. So lets take a look at the page source to see what we really need to scrape.
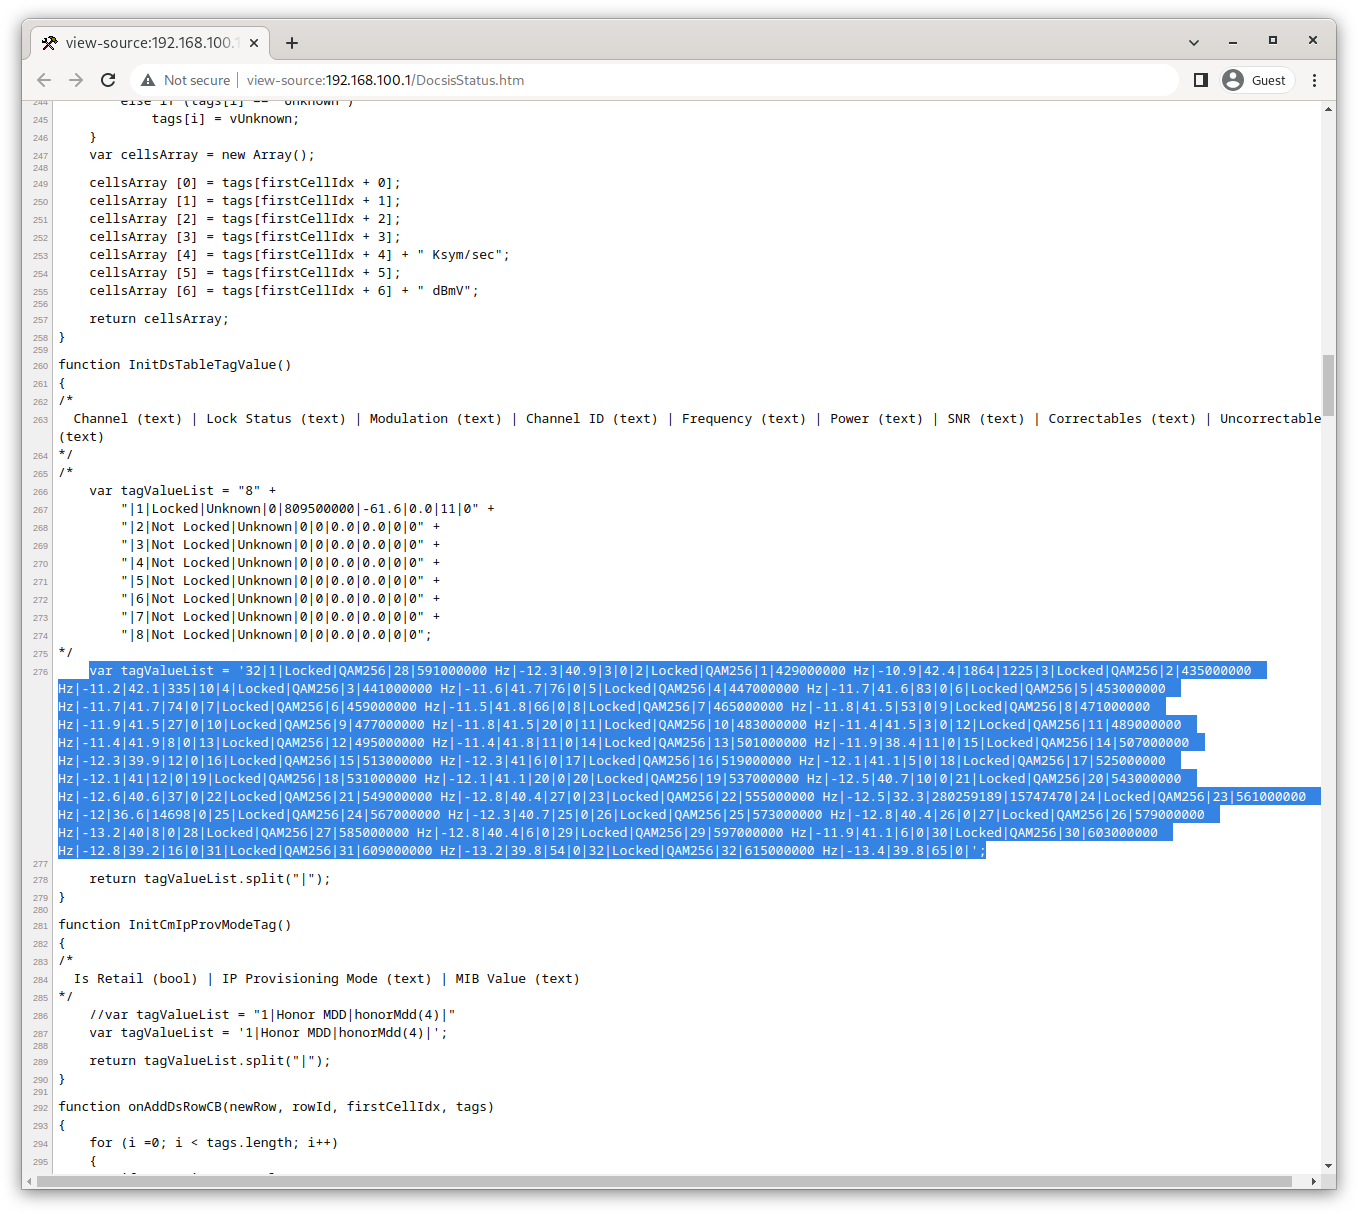
It's an HTML frame-based page. Well isn't that very 1999. But a quick look at that page source and clearly we want the frame produced by http://192.168.100.1/DocsisStatus.htm - the source of the interesting frame. Pop that into Chrome's view-source and ... W.T.F. That's a LOT of JavaScript for such a simple page.
So much JavaScript. They must be using it to reach back to the modem to get the data to display. That could be a royal pain to reverse engineer. But... W.T.F. again. You would expect that if the data is produced when the page is being created you would generate HTML directly. What's happening here, though, is the data is pushed as strings into the JavaScript code which then parses the strings and stuffs the data back into the HTML for display. The JavaScript includes lots of comments including bugs fixed and what looks like someone trying to document the strings with example data. It looks vaguely like this may all be some odd way of reusing SNMP data, but I'm feeling kind of nauseated looking at it. Something about how sausage and laws get made comes to mind. The data we're looking for is highlighted in the screenshot. Note the line-number sidebar, we're almost 300 lines of mostly JavaScript into this apparently simple file.
But the news isn't all bad. Since the strings are static data in the JavaScript, we don't really need to reverse engineer JavaScript, and generate callbacks, we just need to find the data in the page. I was expecting to use BeautifulSoup, but I guess the re regular expression module will be called upon instead. But the Netgear developers have cleverly given all the strings the same name. They're just local to different functions. And for extra fun, even in those functions, we have multiple assignments to those string variables - and even more than once in comments that look very close to the string we need.
Let's start putting some code together. We'll use the requests module to get the data from the modem. That should be simple. Run the request, see the 401 authentication error that's requesting HTTPBasicAuth. Not ideal from a security standpoint, but nice and simple.
>>> import requests
>>> page = requests.get('http://192.168.100.1/DocsisStatus.htm')
>>> page
<Response [401]>
>>> page.headers
{'Content-type': 'text/html', 'WWW-Authenticate': 'Basic realm="Netgear"', 'Connection': 'close', 'Pragma': 'no-cache', 'Set-Cookie': 'XSRF_TOKEN=22948532; Path=/'}
Except trying to get the page with HTTPBasicAuth doesn't seem to work. What about that cookie in there. Hmm. Some cross site request forgery defense. OK. A request to pull that cookie back, pull it out of the headers, and ask for the page we really want with HTTPBasicAuth AND the cookie.
>>> import requests
>>> from requests.auth import HTTPBasicAuth
>>> page = requests.get('http://192.168.100.1/',auth=HTTPBasicAuth('admin', 'A password'))
>>> jar = page.cookies
>>> page = requests.get('http://192.168.100.1/DocsisStatus.htm', cookies=jar, auth=HTTPBasicAuth('admin', 'A password'))
>>> page.ok
True
>>> page.content
b'\xef\xbb\xbf<!DOCTYPE HTML PUBLIC "-//W3C//DTD HTML 4.01 Transitional//EN" ...
Success. We have page data. Some trial and error, and we have the string for the regular expression parser from our page content
>>> re.search(b'InitDsTableTagValue.*vartagValueList = \'32[|](.*)\';.*function InitCmIpProvModeTag',page.content, re.DOTALL)The data is a little messy, but a little simple manipulation and it's all nice and cozy in a dict. It seems like there should be a more elegant way, that I'll probably think of later, but the string has the data colated by channel number, and I'd really rather deal with it by frequency. Since frequency is far from the first thing in the list of channel data, I'm going to wind up storing partial results until we get it, so we may as well, just store the whole thing by channel number and then traverse that data storing it differently. Not great for our runtime efficiency, but it doesn't need to be that fast. Since we're traversing the data anyway, let's report anomalous SNR and Power values while we're doing that. I suppose we should store the anomolies for later analysis, but at the moment, just noting them in output is fine.
So that was a lot of work, but now we have... well, nothing more than was originally displayed. But it's in a data structure. Good start. Since we want to have some resolution on the time of the errors, we'll need to do this frequently - every five minutes for example. But if we store all the numbers from all those runs, that's going to be a lot of data, and a lot of hard to parse data. Remember the counters get reset to zero on a modem reboot, so they'll be going (mostly) up, and sometimes down. Better to keep just the differences. So we'll need to keep the previous run's data to compare. In retrospect, perhpas we should have just grabbed the time on the local box and used that. But it seemed like having the time the modem last rebooted would be useful. If the numbers change for some other reason, maybe there's another problem. I'm not positive, but I think if the modem completely looses connection it also resets the counters. And there's the reboot time right there at the bottom of the page! Don't see it? There's the current system time and there's the time since last reboot. Simple math.
We wish it were simple. That information isn't really at the bottom of the HTML page. You guessed it. Burried in a JavaScript string set statically in the page JavaScript. So another round of regular expression building. Now it's just math... but no. Even though those are provided as raw data to the JavaScript which could then do anything to them, they're coded in as strings. A date time string with no timezone information. Look up at the wall clock, and yup, it's local time - as set by Comcast. No user control for timezone. So it's ambiguous local time - especially during daylight savings time changes. Yea.
So we'll look into the Python time functions. A more wretched hive of scum and villany... or something like that. So import the time module. Oh, and that doesn't handle "time deltas" like "1 hour ago", but we have a time delta for the uptime of the cable modem. So we'll need timedelta from the datetime module. And for maximum fun, the built-in libraries have a way to create a human readable time delta, but not a way to get back from human readable to some canonical time delta. So we need timeparse from the pytimeparse module. pip install pytimeparse and we're getting close. Now a few manipulations and we're there.
>>> boot_data = re.search(b'InitTagValue.*var tagValueList = \'(.*)\';.*function InitUpdateView', page.content, re.DOTALL)
>>> boot_list = boot_data.group(1).split(b'|')
>>> sys_time = int(time.mktime(time.strptime((boot_list[10].decode('utf-8')))))
>>> uptime = timeparse(boot_list[14].decode('utf-8'))
and, of course,
boot_time = sys_time - uptimeand we can check with
print(f'Modem Rebooted at {time.asctime(time.gmtime(boot_time))} Currently up {timedelta(seconds=uptime)}')And the rest is really fluff. Save the (sometimes intermediate) result data as json for use by a reporting script and when the script needs to restart. Trivial with the json module.
And we'll need to get and keep it started. Enter systemd (on a linux system) See: https://medium.com/@benmorel/creating-a-linux-service-with-systemd-611b5c8b91d6 and https://www.freedesktop.org/software/systemd/man/systemd.unit.html
We'll put our service in /etc/systemd/system/ModemCheck.service
and mkdir /usr/local/lib/ModemCheck and put our ModemCheck.py there.
And finally, the point of the exercise was to see the errors as time series data. ModemDisplay uses the json module to pull the data from the store created by ModemCheck. Although the plotly module does A LOT and therefore is a little complicated to get into, it's really pretty straightforward for simple graphs like ours even though it produces really amazing ouput. So a quick cron job to rsync the resulting html output to a server from time to time and we can easily track the state of the cable modem over time.
06 */2 * * * /usr/local/lib/ModemCheck/ModemDisplay.py -d /var/log/ModemCheck/ModemData.json -o /var/log/ModemCheck/ModemData.html && rsync /var/log/ModemCheck/ModemData.html /var/log/ModemCheck/plotly.min.js [email protected]:secure_html/ModemCheck/ && rm -f /var/log/ModemCheck/*.{html,js}Sample results can be seen at https://holmgrown.com/ModemCheck/ which is produced by just such a cron job.


