In any arbitrary field, I probably know so little that I may not even know what there is to know. It would be convenient to be able to browse an interactive visualization of all the research being done on and related to a chosen topic such that each research paper would correspond to a point in space. Related papers would form clusters, which together would constitute a structure in space visually representing the structure of our knowledge. Reading about a subfield would amount to exploring a cluster. Rather than clicking on a series of links to figure out which related topics are important, I would be able to quickly gauge the popularity and relevance of other topics by the size and proximity of nearby clusters.
Can we easily reveal some underlying structure in the relationships between academic paper abstracts using a combination of Truncated SVD and t-SNE?
I originally planned to approach this task by interacting with the arXiv API, but I then came across the relatively new website called Semantic Scholar, which uses AI to analyze publically avaiable research papers and extract "authors, references, figures, and topics" from them. Since my project requires access to large amounts of data, I downloaded its entire "open research corpus", which contains information on over 7 million research papers. The download is a single massive (18 GB) JSON file, so I began by splitting the file up into more manageable pieces, each containing information on only about 100,000 papers.
I decided to compare paper abstracts by assuming that if the same words appear in multiple abstracts, those abstracts are considered similar. It's not a very sophisticated analysis—since (1) it doesn't take into account the fact that different words can be synomnyms of each other and (2) the context in which words are used can affect their meaning—but it should allow us to extract a shallow level of connection between papers.
To process each abstract, I first passed the text through a Porter Stemmer, which is an algorithm from the late 1970s that prunes words into "stems" such that, for example, all the words in {"traveled", "traveling", "travel", "traveler"} are transformed into the stem "travel". This normalizes text to quench noise caused by differences in tense, plurality, etc.
With that taken into account, I surveyed 10,000 abstracts drawn at random from one of my 100,000-paper files to tally up the number of appearances of each word stem found. From the resulting list of ~70,000 stems, I made a list of the 10,000 most commonly used stems (with "the" in first place at ~110,000 counts, and a host of seemingly random stems like "religion", "mileston", and "ductal" near last place at just 8 counts). These stems serve as the basis vectors which span the space into which we can embed each abstract. For each of another 5,000 abstracts randomly drawn from the file, I recorded the number of times each common stem appeared, and stored that number in the corresponding vector position, normalizing each paper-abstract vector such that its components summed to 1 (thus, the value of a component represents the fraction of the abstract constituted by the corresponding stem). This process results in a collection of 10,000-dimensional vectors, which, without any further processing, would be impossible to visualize. To do that, we need some way of mapping the high-dimensional data into an analog of physical space. For this project, I attempted to use a combination of Truncated SVD and t-SNE.
Though the t-Distributed Stochastic Neighbor Embedding (t-SNE) algorithm tends to be very useful for representing high-dimensional data in 2- or 3-dimensional space while preserving local structure, it is quite computationally expensive (it minimizes the Kullback-Leibler divergence, or relative entropy between the high- and low-dimensional data distributions, which is nonlinear and pretty complicated). Before applying t-SNE, then, it helps to map to some lower-dimensional representation. For dense data, PCA works better, and for sparse data, Truncated SVD works better (see here). Since many of the components of each paper-abstract vector are 0, the data is "sparse", and Truncated SVD is the way to go. Singular-value Decomposition (SVD), commonly used for Latent Semantic Analysis (LSA) is essentially a generalization of eigenvalue decomposition, so Truncated SVD just keeps the most important vector directions and prunes the rest to project the data into a lower-dimensional space.
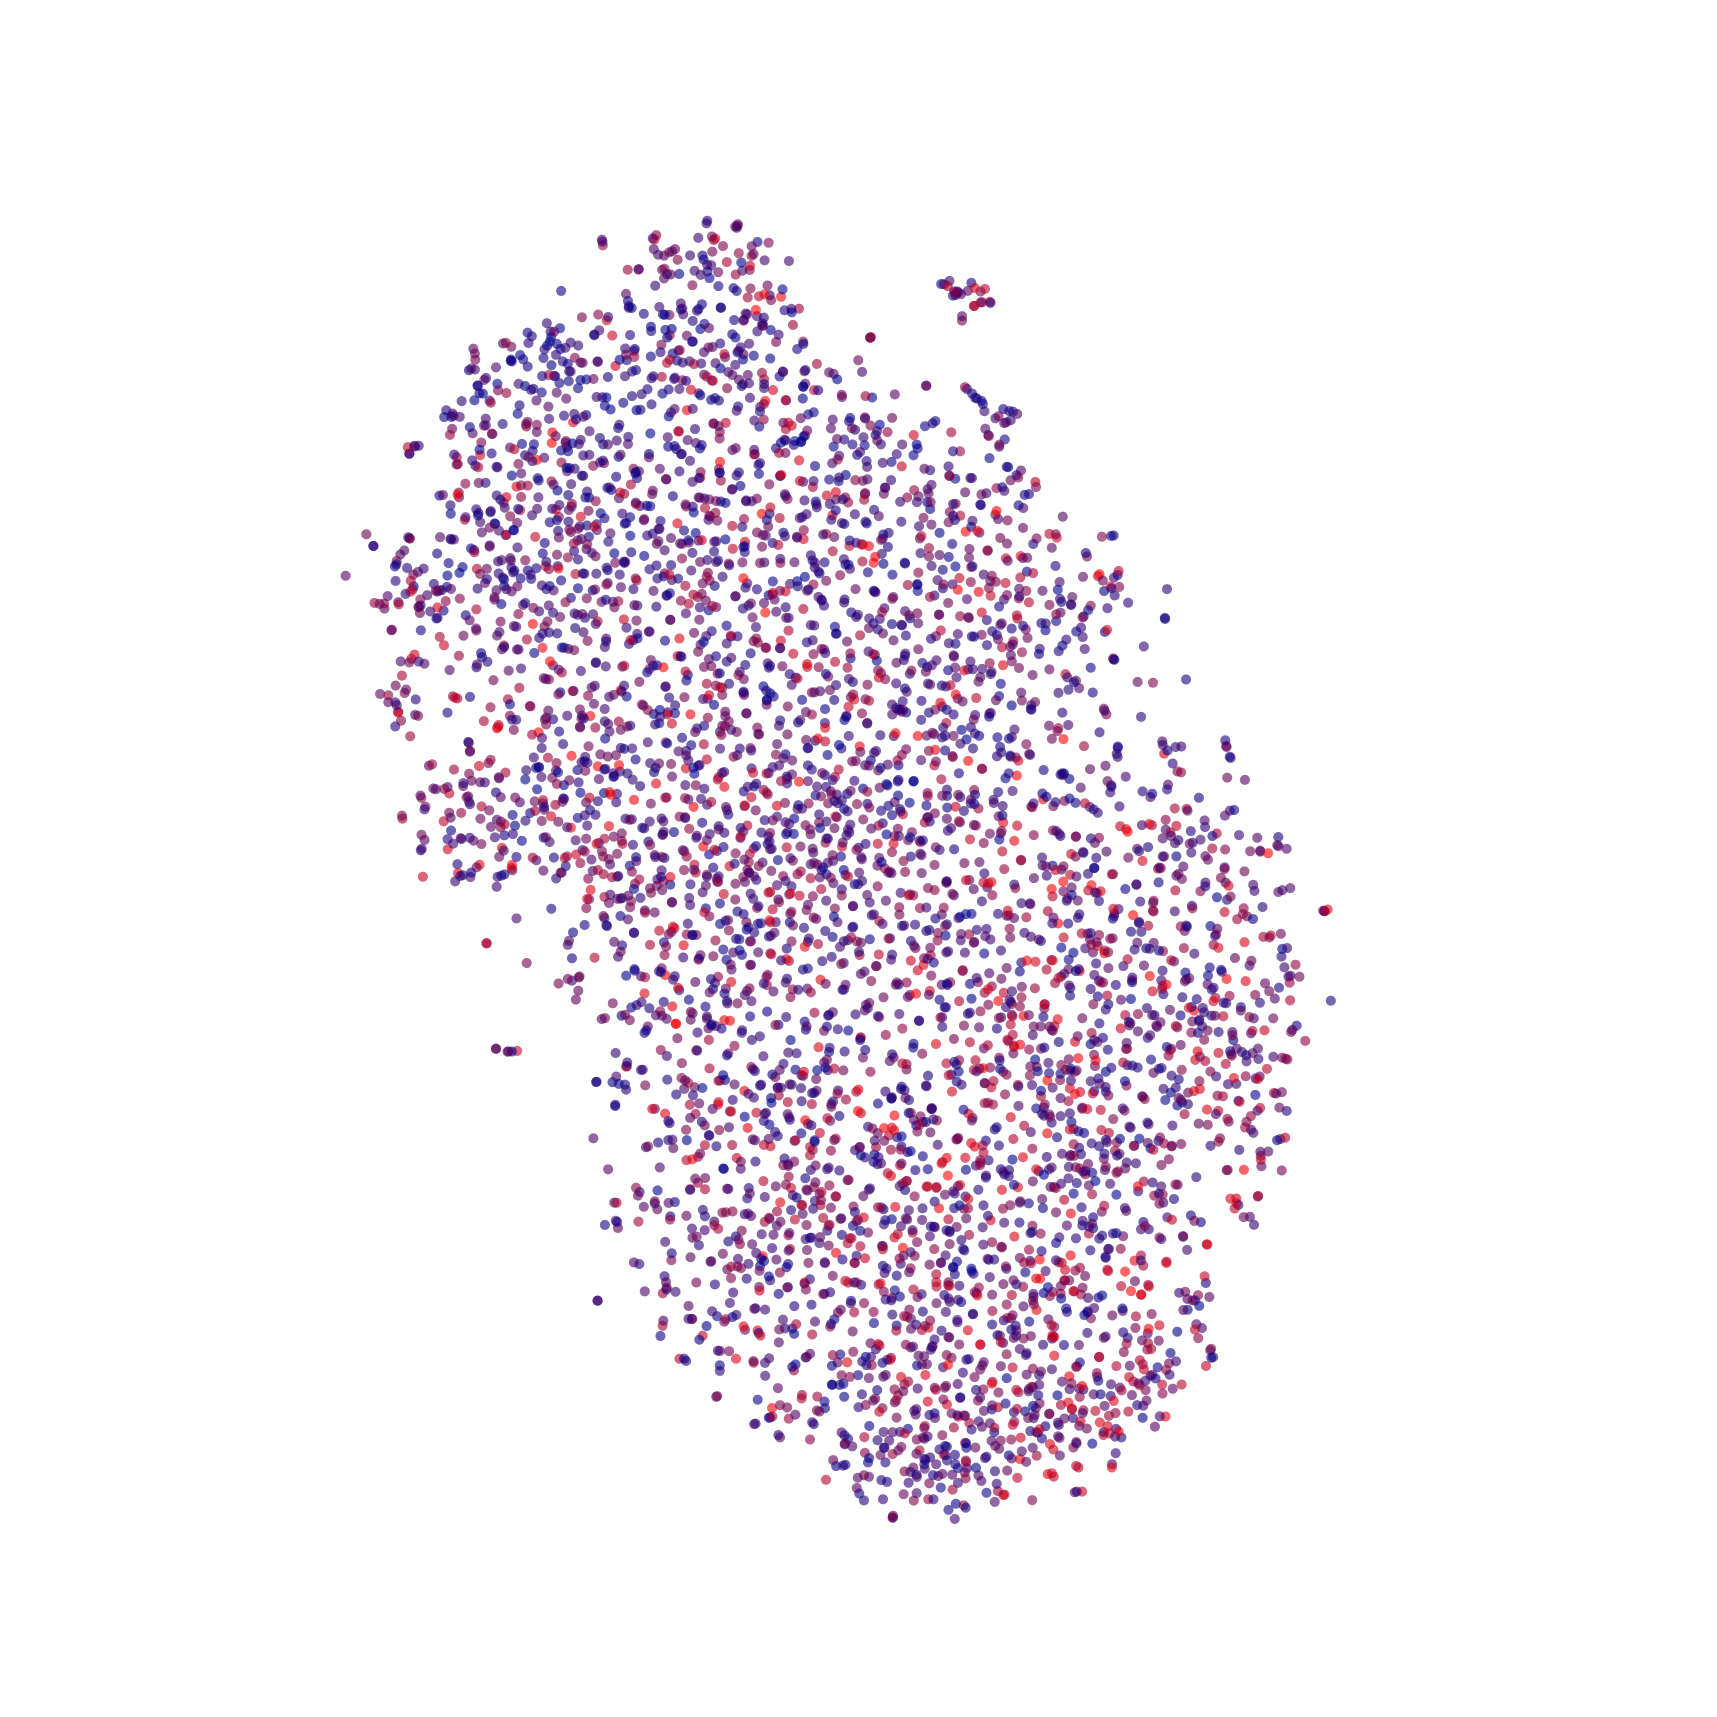
Thus, mapping from 10,000 to 128 dimensions with Truncated SVD, then from 128 to 2 dimensions with t-SNE, I ended up with something that looks like this blob:
I've colored the points according to publication date (redder is older, bluer is newer)—clearly, t-SNE did not separate the data according to date. Without any other means of labeling, it is quite difficult to tell whether t-SNE has managed to successfully extract any structural information from the dataset. If we inspect the content of the points, however, we find that the small lobe separated near the top right consists of abstracts largely written in French (whereas the rest are largely in English). So, the embedding and dimensionality-reduction did preserve some structure, it's just not clear at the moment the extent to which it preserved that structure. Ideally, I would like to redo this analysis with papers which have their field of study labeled (e.g. "physics", "medicine", "mathematics", etc.), so that I can generate a more meaningful color scheme, but such data is not currently available in the Semantic Scholar dataset. Additionally, there are a number of adjustable parameters for each of the algorithms I used, on top of the fact that they are both stochastic (thus generating different results for each run even if the parameters are kept the same). t-SNE is also prone to getting stuck in local minima, so the result I obtained here may not be optimal (even if I happened to choose the perfect parameters).
It may be worthwhile to approach this visualization project with a better initial embedding model. After creating the model I described above, I employed tf-idf weighting (the standard weighting scheme used in LSA) rather than the simpler "term-frequency" weighting scheme that I started with, but I did not see any obvious changes in the output structure. Continuing this project, I plan to research methods in LSA further, since my current approach may be lacking in subtleties that have led to successful results in LSA in the past. In addition, to address the problem of synonyms and context (see (1) and (2) in Embedding above), I could try training some form of Recurrent Neural Network (RNN) to learn relationships between words, and generalize this to learn relationships between abstracts. The dimensionality reduction from Truncated SVD does help to group together similar terms and concepts, but I'm not sure how effectively it is performing.
Again, after modifying the initial embedding and dimensionality reduction, I will generate a 2D visualization with t-SNE. I wonder, however, whether t-SNE is even capable of capturing the level of structure I desire. The algorithm is sensitive to distance between nearby points, but because of its use of Gaussian kernels, past a certain range, it doesn't care whether a point is "far away" or "really far away". This might limit the model's ability to represent the fact that two very different subjects are in fact very different from each other. On the other hand, maybe only the topology of the cluster network matters, since disparity between subjects may be inferrable from distance along a chain of clusters.
Rather than creating embeddings based on the text in abstracts, it may also be useful to visualize structure using a graph-based approach where edges between nodes are formed by paper citations. Using the Semantic Scholar resources which automatically identify how influential a source is on the work of the paper citing the source, we could assign edge weights based both on number of citations and importance of each citation. The result might look something like what Chris Olah did with fanfiction.net.
Without a good secondary labeling system, I realized that it was very difficult to tell whether my first attempt adequately clustered similar abstracts together. To remedy this, I returned to my initial plan of using the arXiv API to retrieve the desired information. In addition to the same title, abstract, and publication date information that Semantic Scholar provides, arXiv also tags each article with the "primary category" to which that article belongs. While this won't help the clustering algorithm work any better (since the category does not factor into the paper abstract embedding), coloring the final points according to research category will allow us to more appropriately judge the clustering of similar articles by the clustering of each color.
To collect articles from the arXiv API, I kept just the first 5000 results from the search term "the". I assumed that, since "the" is the most commonly used word in the English language, this query should return a reasonably representative sample of the content on the arXiv. Of these 5000, I kept only articles belonging to the population's 10 most frequently appearing research categories (reducing the number of papers to 4583). I also opted to forgo the randomization procedure I employed in Attempt #1 since I believe that instead of making my analysis more statistically fair, it only added unwanted noise with no benefit. In Attempt #2, I performed the tf-idf weighting and embedding procedure on all 4583 documents so that the abstracts-to-be-embedded formed the document pool from which tf-idf weights were determined (more closely matching standard LSA practice than my first attempt).
Most importantly (I think), when I embedded the abstracts in high dimensional space, I did not arbitrarily truncate any of the dimensions. In my first attempt, I kept only the most frequently appearing word stems because I thought that allowing the embedding to of such high dimensionality would be computationally prohibitive. I now realize that doing so is probably what caused the t-SNE algorithm to fail, generating only very weak apparent clustering. The most important similarities between abstracts come from words that are used infrequently, many of which I previously ignored. In this attempt, I kept every word stem, embedding the abstracts in their full 19910-dimensional space.
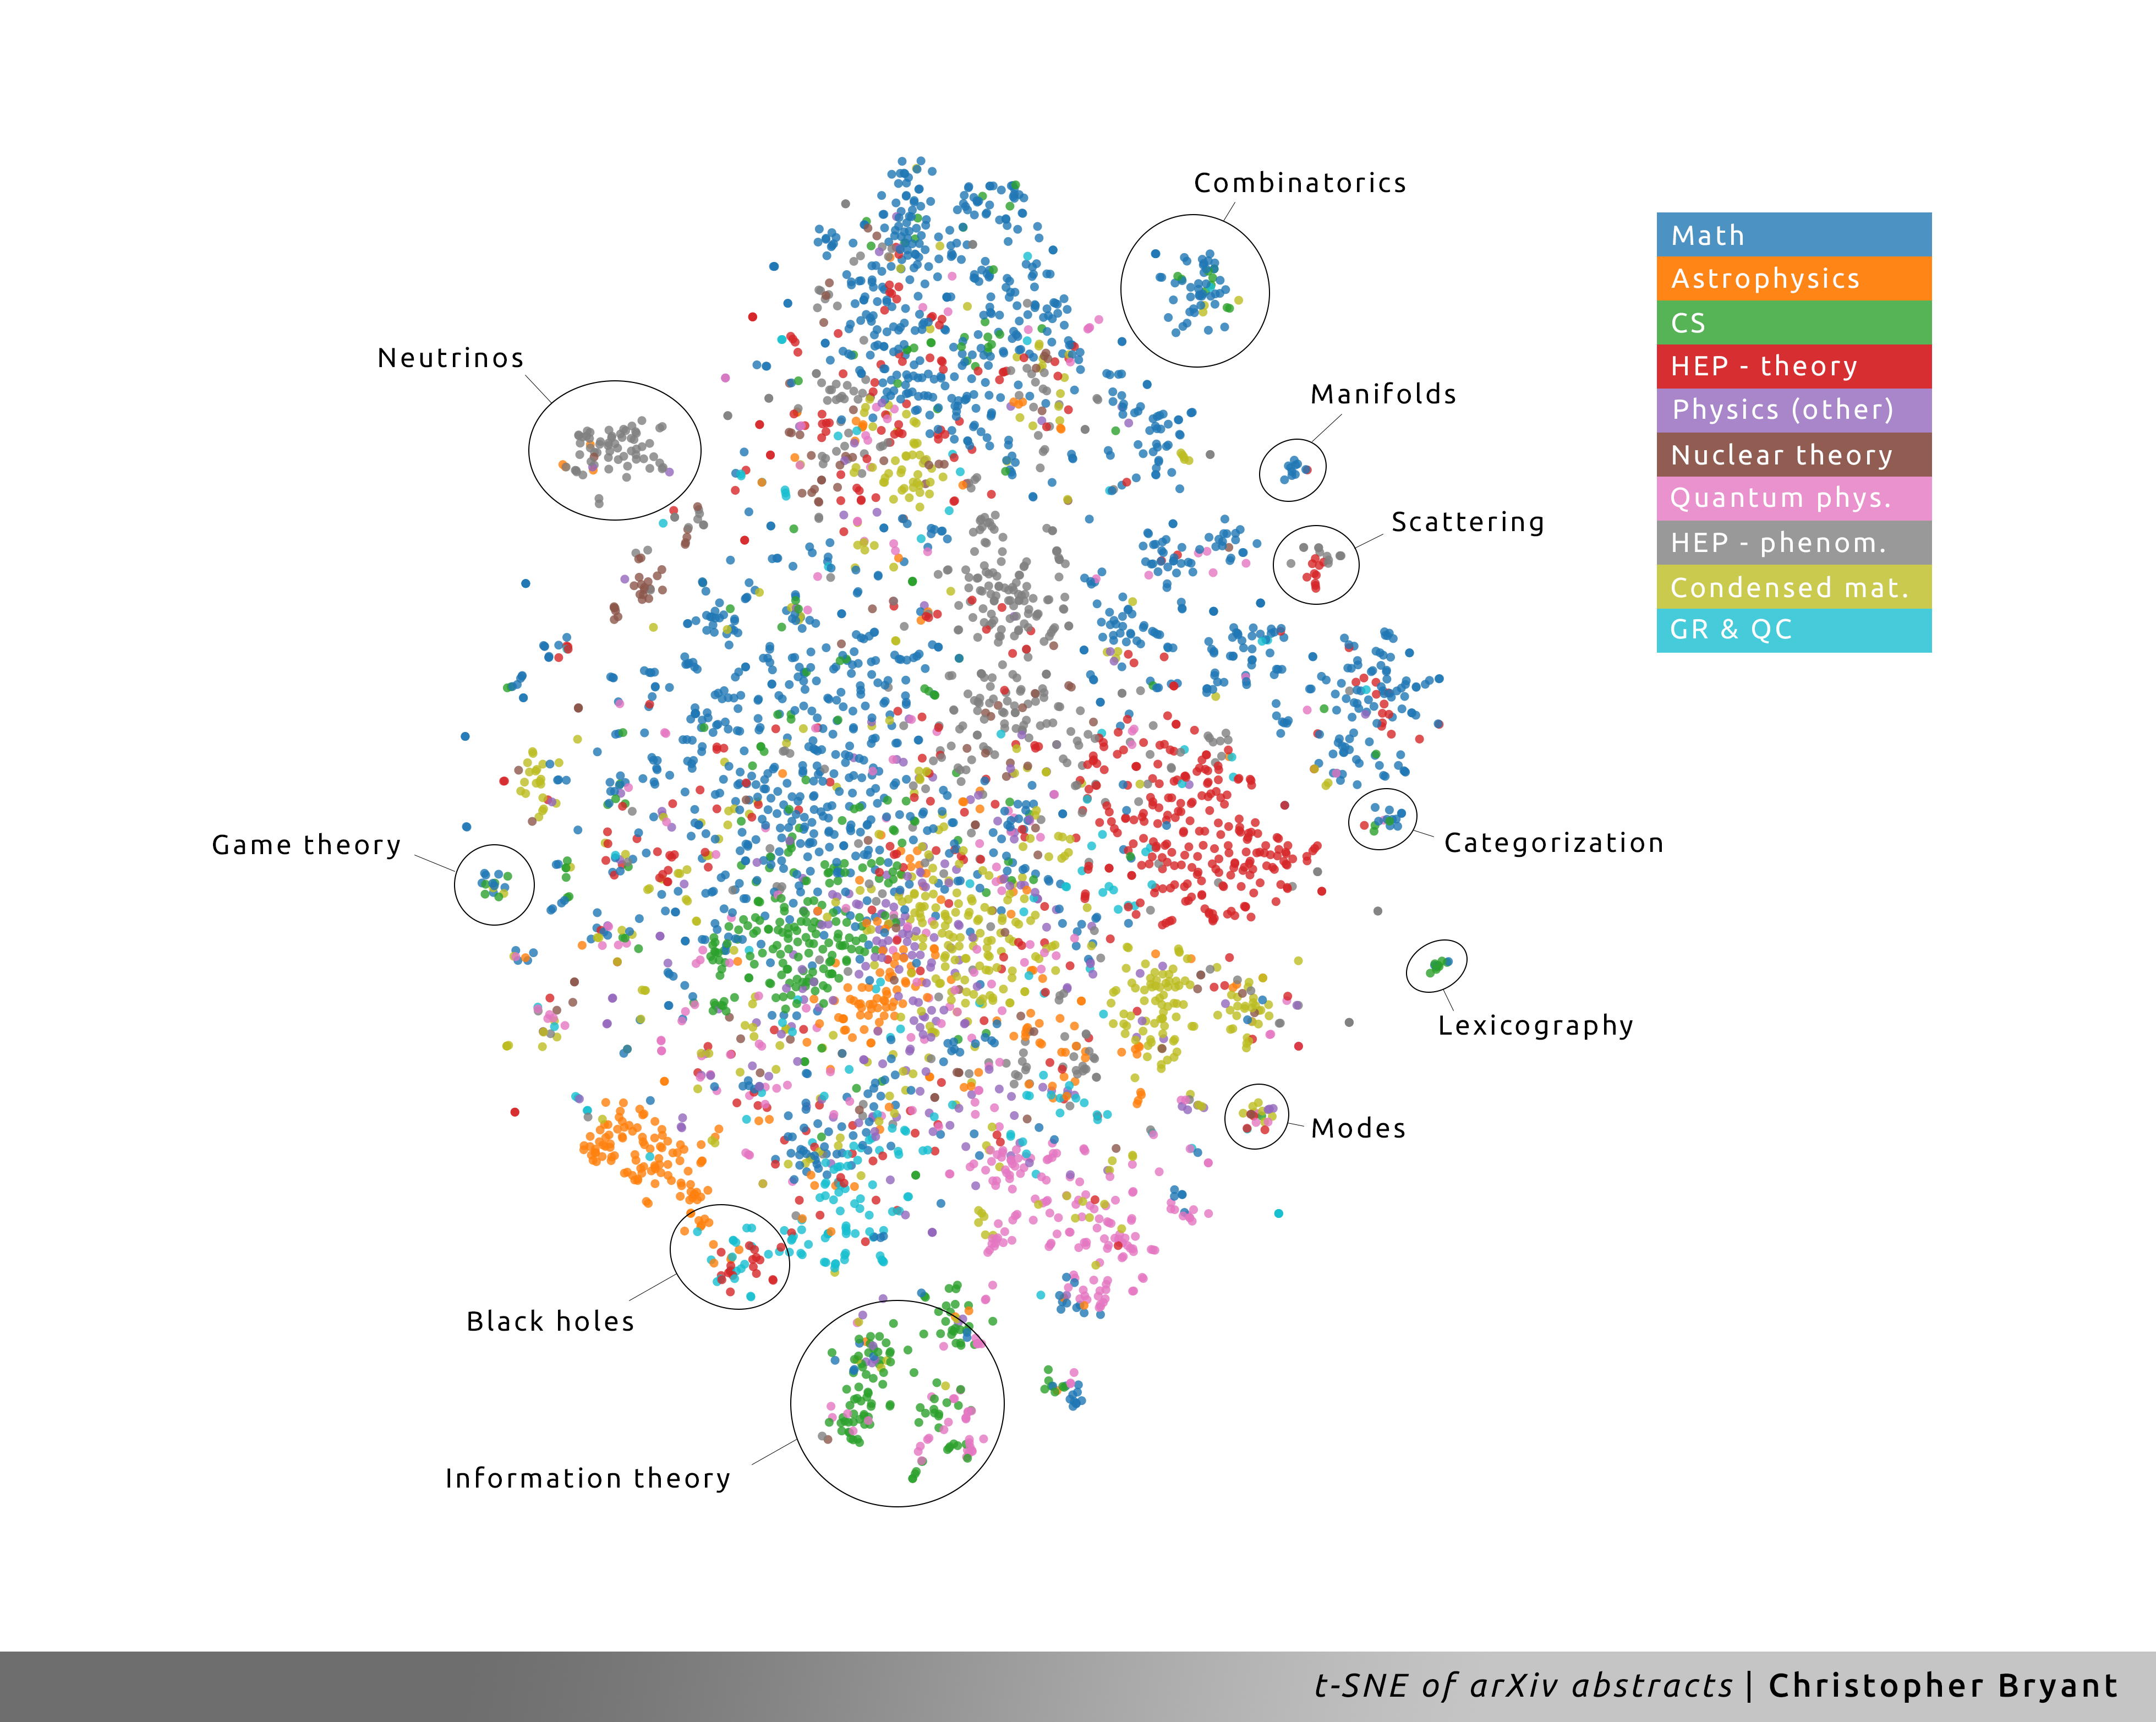
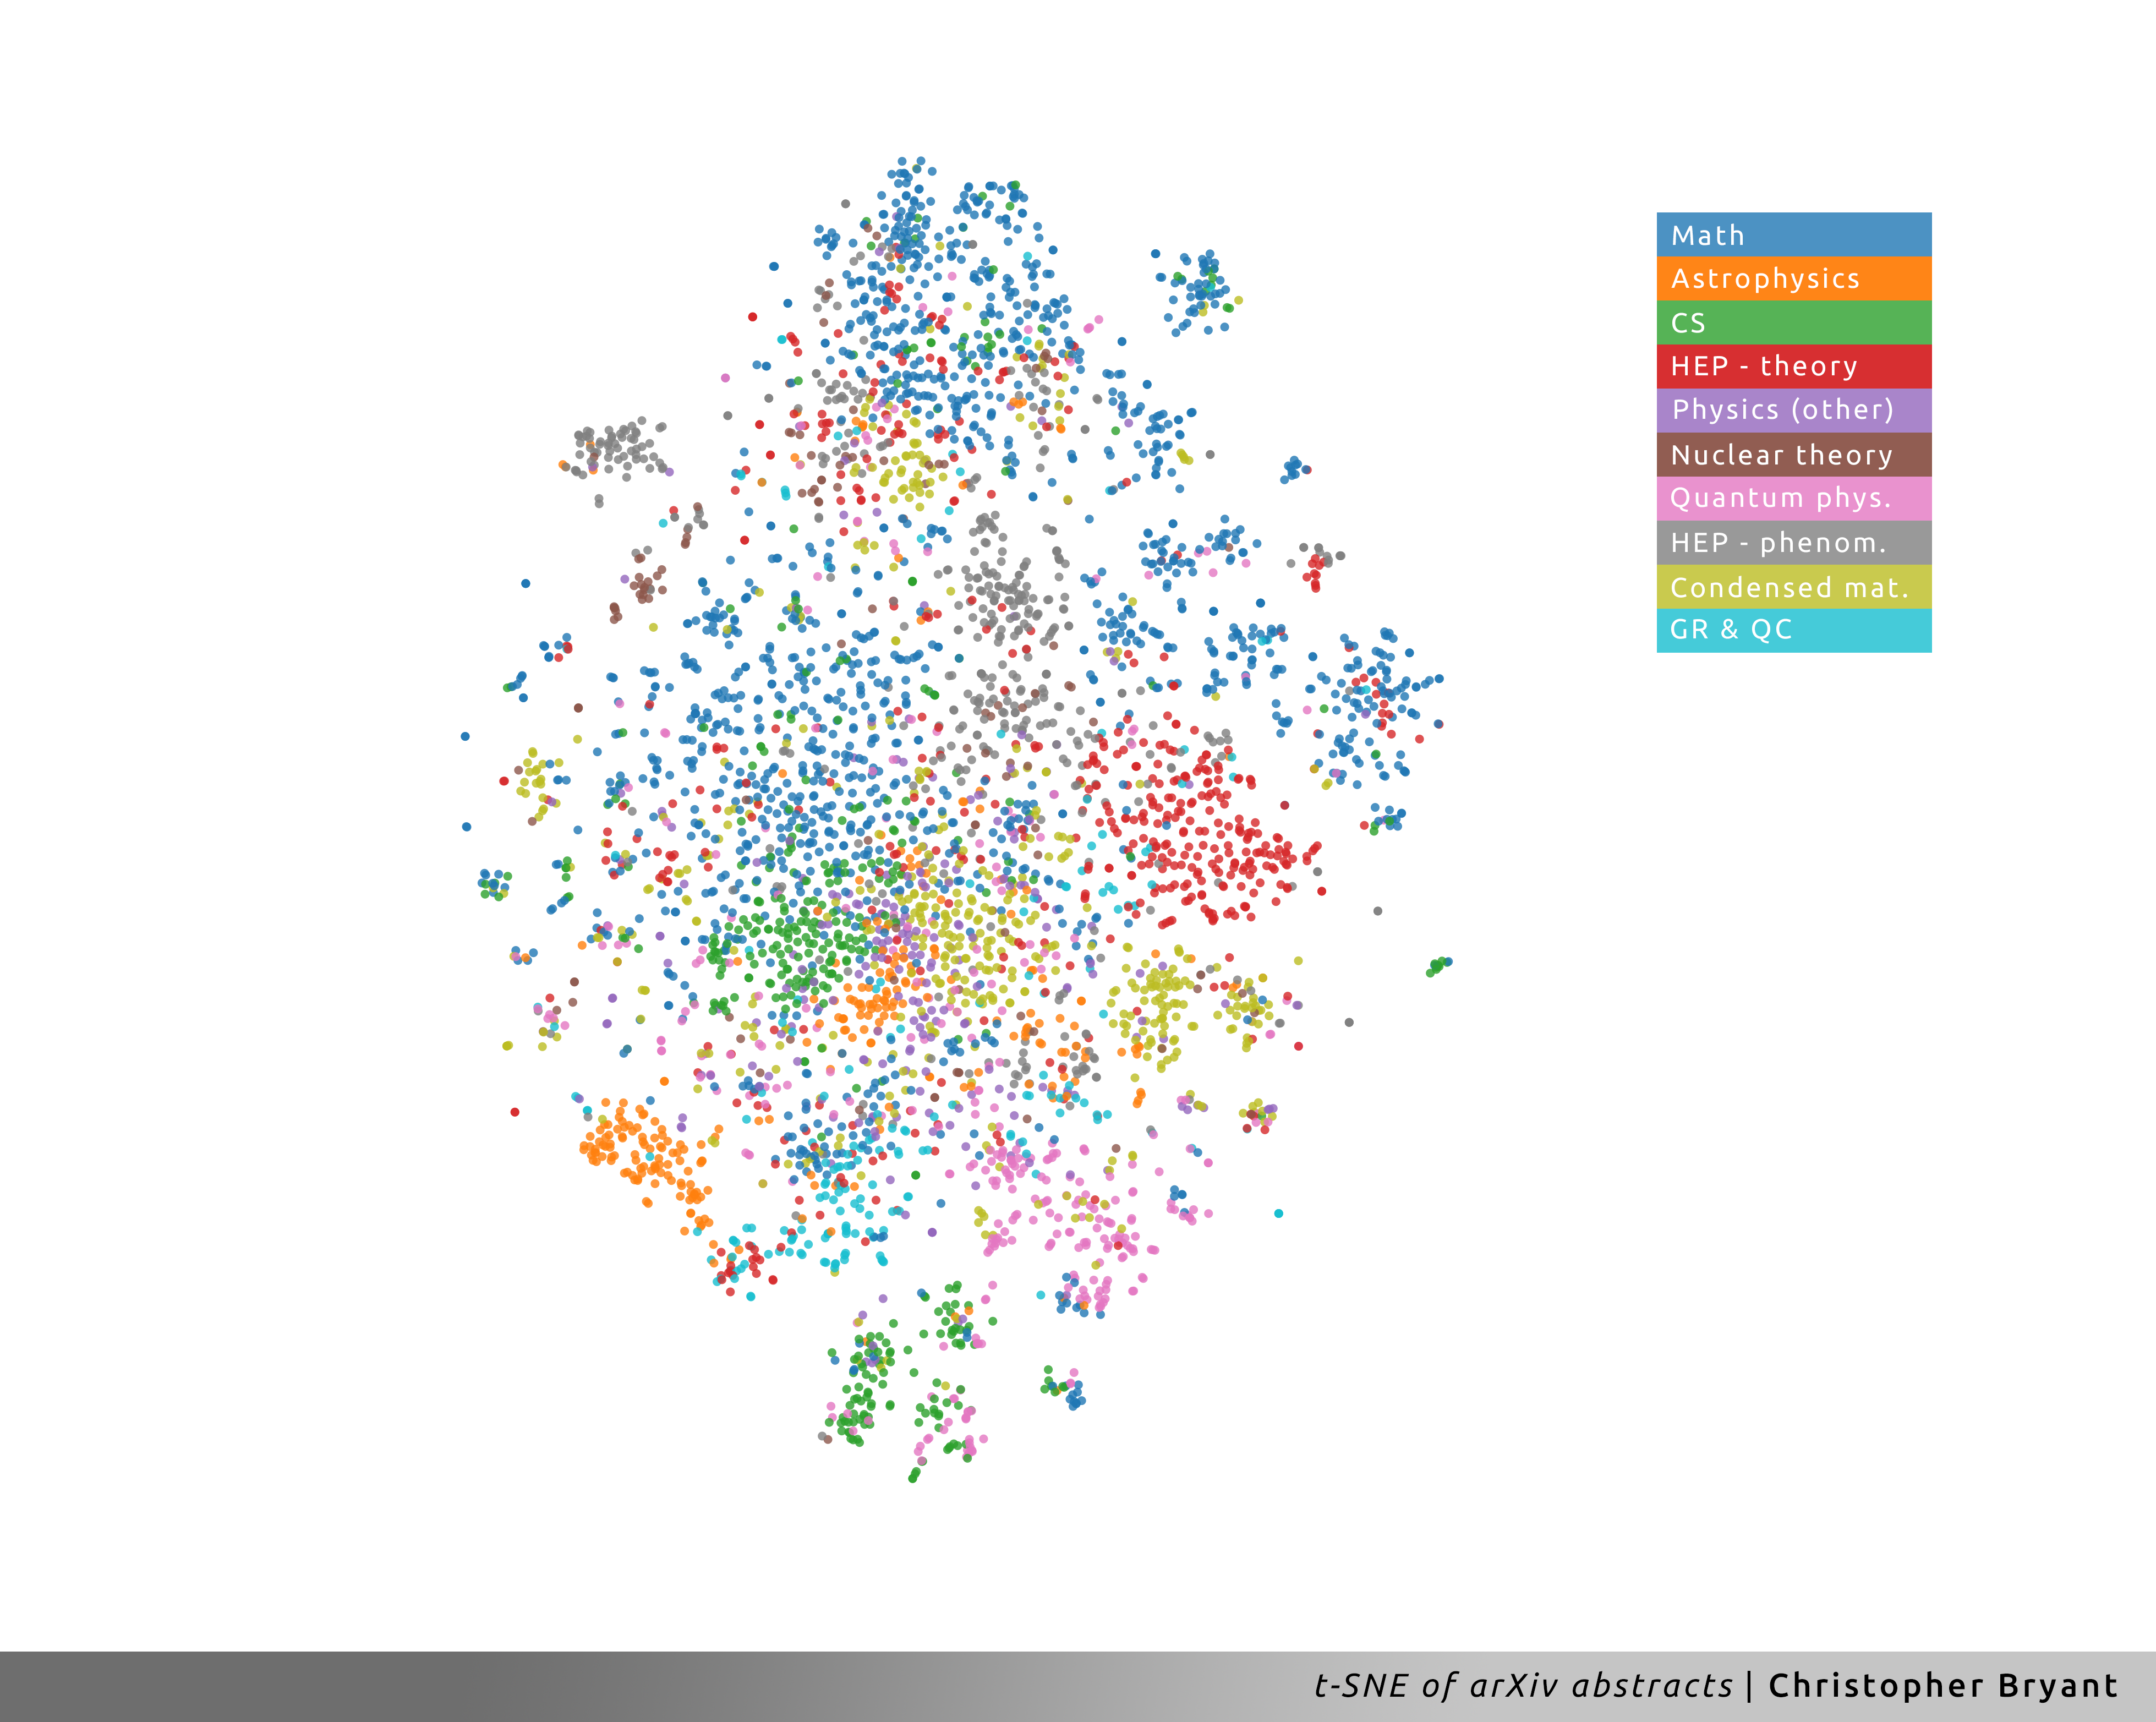
After the embedding, I performed the same Truncated SVD and t-SNE procedures as before (reducing the data dimensionality to 128 and 2 dimensions, respectively). Immediately, even without color cues, the difference between Attempt #2 and Attempt #1 is striking. The clustering here is far more structured, and with color labels, we can see that the structure is indeed representative of the categories which arXiv has the papers grouped under.
Furthermore, by taking a closer look at the content of some of the better-defined clusters on the periphery, we can glean some subfields of research. For instance, the gray cluster of High Energy Physics Phenomenology (HEP-phenom) papers near the top left appears to encapsulate the relatively large research efforts devoted to studying neutrinos. In contrast, near the middle right, we find the tiny cluster of papers in Computer Science (CS) and Math studying the formal theory of words and alphabets. What I find most interesting, however, are the clusters which imply the interdisciplinary nature of a subject. For instance, at the very bottom, a large compound cluster of mostly CS and Quantum Physics papers on information theory, which has applications in quantum computing and quantum information. Lastly, I want to point out the black hole research area just above and to the left of that. Here, we get a nice visual representation of the extreme nature of black holes, which necessitate discussion from researchers all over physics: astrophysics, HEP theory, general relativity, and quantum cosmology.
- Processing: arxivstruct_2.ipynb
- Visualization: arxivstruct_TSNE_from_arXiv.html


