Welcome! In this file you will find some tutorials that are part of the Oracle APEX Workshop performed by Breno Comin ([email protected]), from Oracle LAD Alliances & Channels team.
Day 1
- What is APEX?
- Creating and setting up the APEX Services
- Creating an app from a Spreadsheet
- Understanding Reports and Creating first application
Day 2
- Creating Database Tables/Modelling
- Working with Forms
- Creating Validations and Lists of Values (LOV's)
- Creating a Calendar View
Day 3
Oracle Application Express is a low-code development platform that enables you to build scalable, secure enterprise applications with world-class features that can be deployed anywhere.
Application Express provides you with an easy-to-use browser-based environment to load data, manage database objects, develop REST interfaces, and build applications which look and run great on both desktop and mobile devices.
Application Express embraces SQL. Anything you can express with SQL can be easily employed in an Application Express application. Application Express also enables low-code development, providing developers with powerful data management and data visualization components that deliver modern, responsive end-user experiences out of the box. Instead of writing code by hand, you are able to use intelligent wizards to guide you through the rapid creation of applications and components.
Oracle APEX used to require an Oracle Database license, but on Oracle Cloud Infrastructure we have something new: Oracle APEX Application Development, which is a low cost Oracle Cloud service offering with convenient access to the Oracle Application Express platform for rapidly building and deploying low-code applications.
APEX Service includes the following components:
- Oracle Application Express
- Oracle Database Actions (SQL Developer Web)
- Oracle REST Data Services (ORDS)
- OCI Console UI for APEX Instances
Upon signing in to OCI, the OCI Console homepage appears. The next step is to use OCI Console to create an APEX Service instance which also creates an underlying Oracle Autonomous Database.
To create an APEX Service instance:
- Navigate to the OCI Console Sign-In Page and sign in as described in Access Oracle Cloud Infrastructure.
- In the upper left corner next to the Oracle Cloud logo, click
.
- From the Oracle Cloud Infrastructure left navigation list, under Database Related Services, select APEX Application Development and then APEX Instances.
- Choose your Compartment.
- At the top of the APEX Instances page, click the Create APEX Service button.
- Enter the required information and set the configurations before clicking Create APEX Service.
To set up a New APEX Service:
-
On the APEX Instance Details, click Launch APEX.
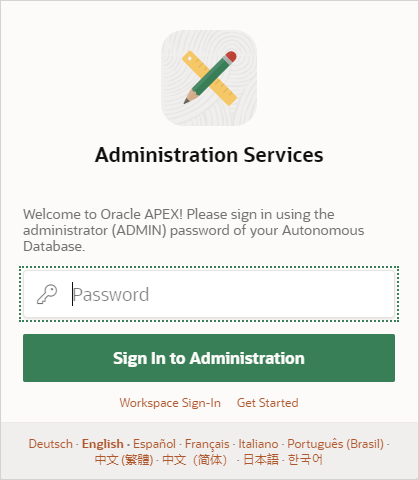
The Administration Services Sign In page appears.
-
On the Administration Services Sign In dialog:
-
Password - Enter the password your specified when you created your APEX Service.
-
Click Sign In to Administration. A Welcome page appears and prompts you to create a workspace.
-
-
On the Welcome page, click Create Workspace.
-
On the Create Workspace, specify the following:
-
Database User - Select the existing database user for the workspace from the list, or enter a new username. This user will be the workspace administrator. Applications will be created against database objects from this schema.
-
Password - Enter a password for the database user. A password is required only if you are creating a new user. The password you specify must meet the default password complexity rules. See field-level Help for details on password complexity rules.
-
Workspace Name - A workspace is a shared work area where multiple developers can build applications. By default, the wizard populates this for you. Accept the default or enter a name for the workspace.
-
Click Create Workspace.
-
-
Sign out of Administration Services and sign-in again.
-
On the Oracle Application Express Sign In page, enter your workspace administrator account credentials, with your just created Workspace, and the DB Username/Password.
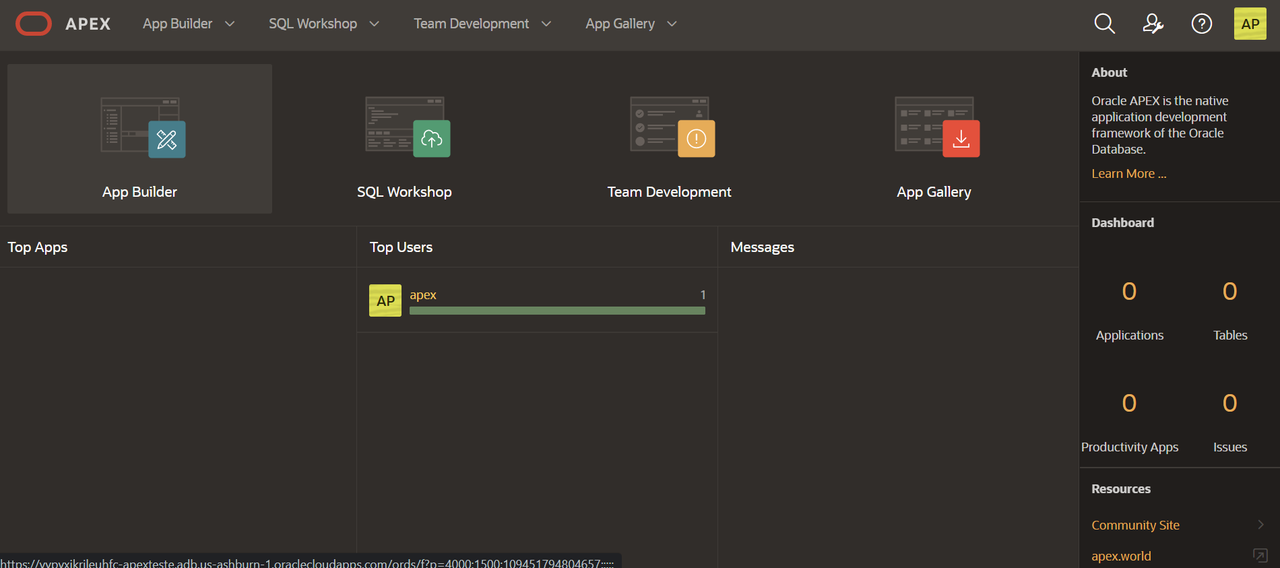
After you have logged into your workspace, you can start creating APEX applications. In this lab, you will build a simple application based on a spreadsheet. Keep in mind that APEX is great for a variety of apps, from simple ones like this to large, sophisticated apps based on local database objects, REST enabled SQL objects, and even REST APIs.
-
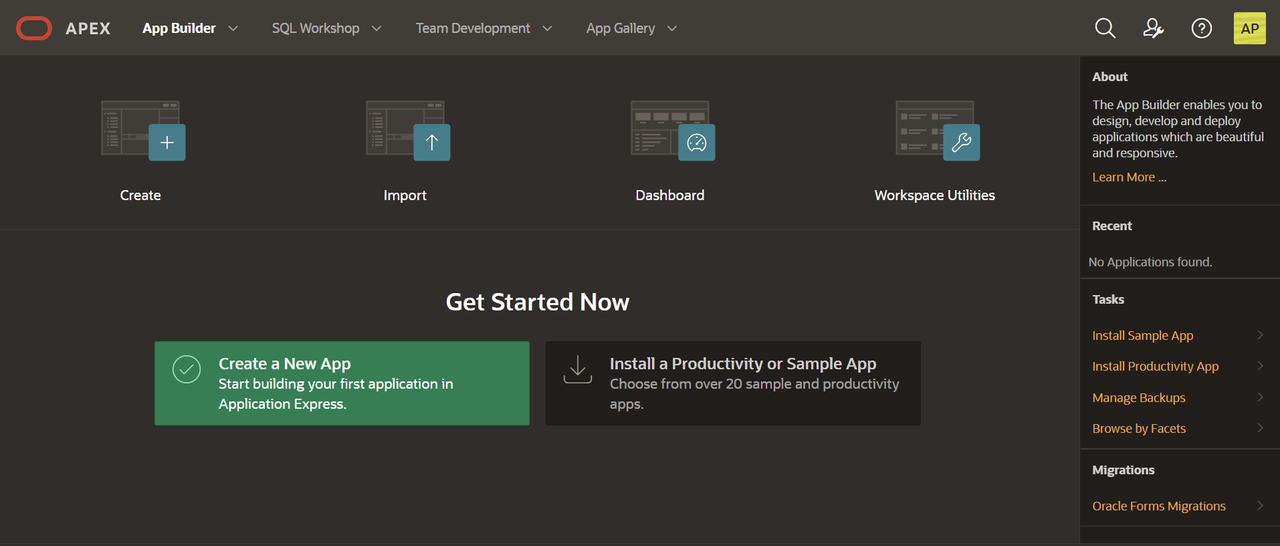
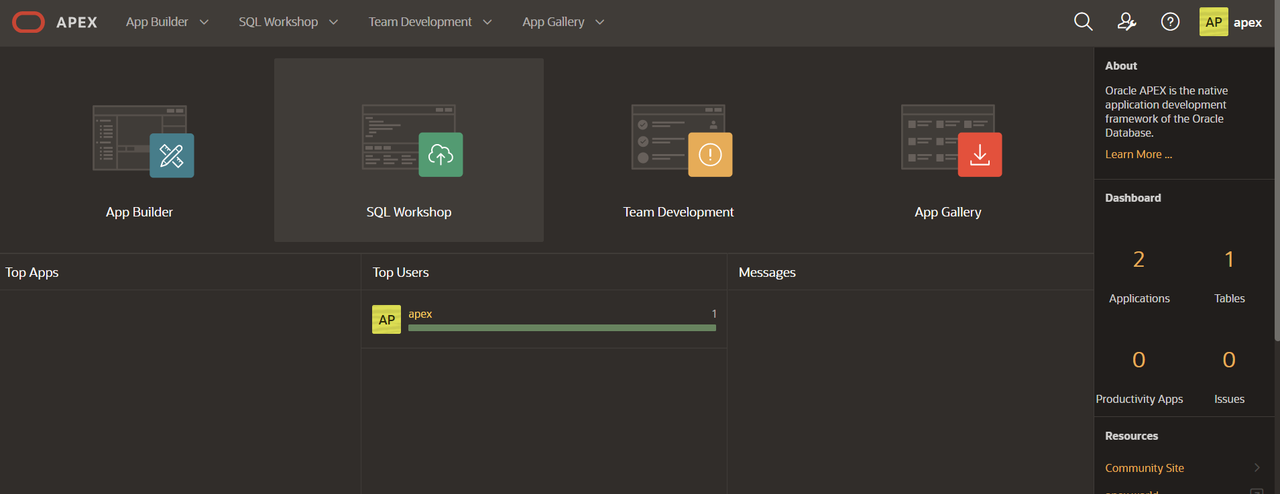
From your APEX workspace home page, click App Builder.
-
Click Create a New App.
-
Click From a File.
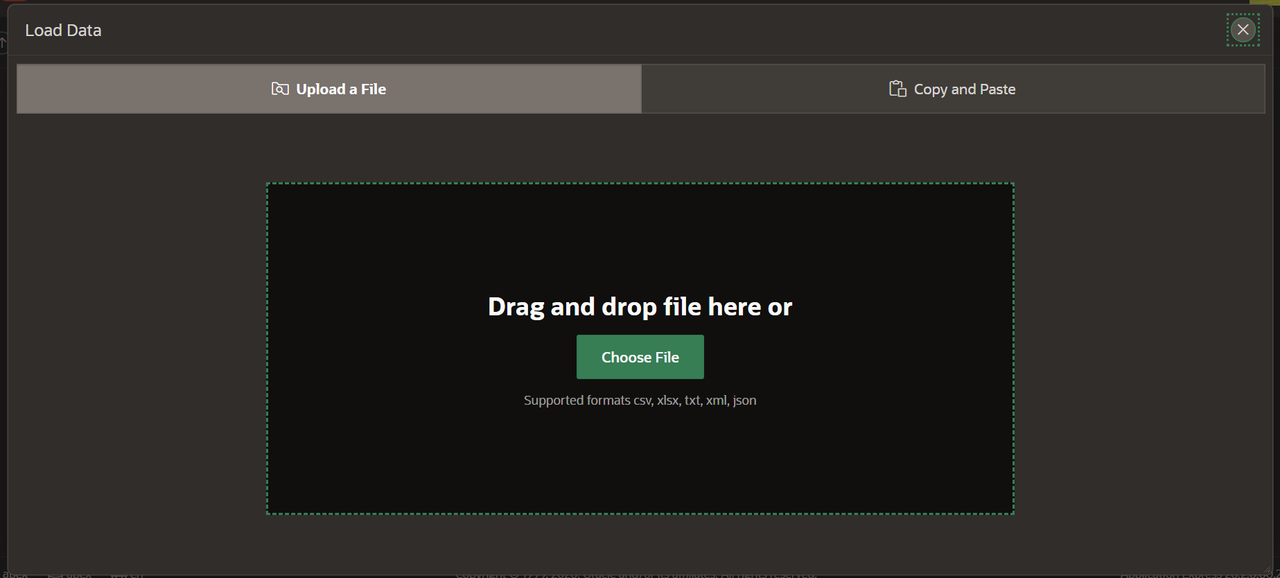
When creating an application from a file, APEX allows you to upload CSV, XLSX, XML, or JSON files and then build apps based on their data. Alternatively, you can also copy and paste CSV data or load sample data.
-
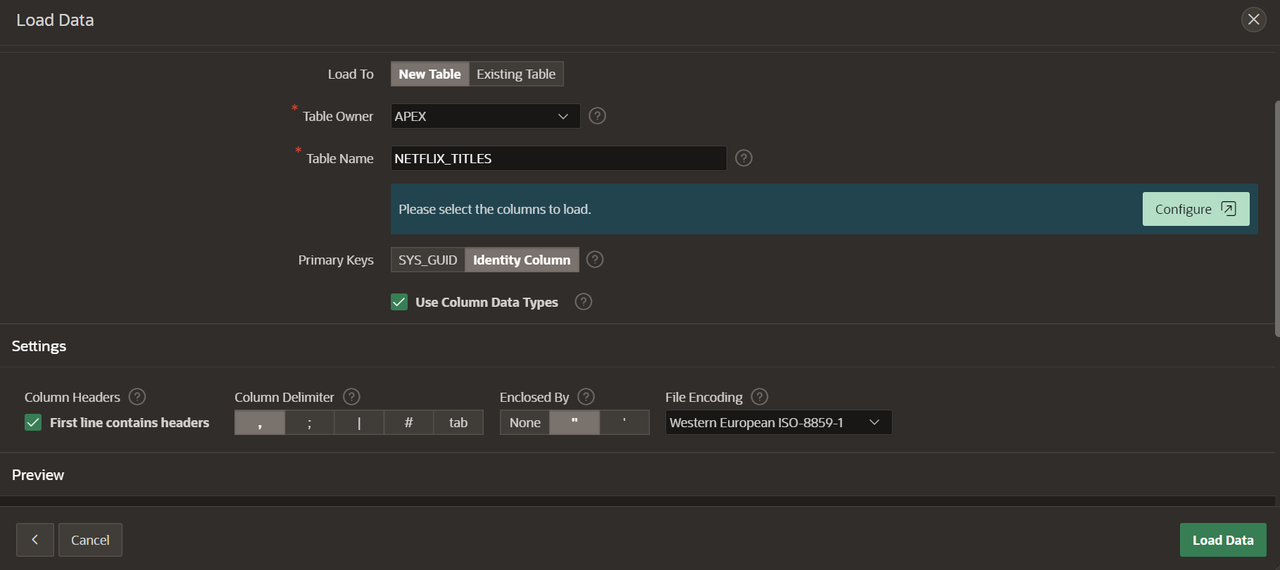
Within the Load Data wizard, Upload your files to the database.
In this example I have used the netflix_titles.csv file
-
The wizard will help you to create a database table to store all the data, respecting the data formats from the spreadsheet. We will maintain every setting at default now, but keep in mind that we can manage this table when necessary.
-
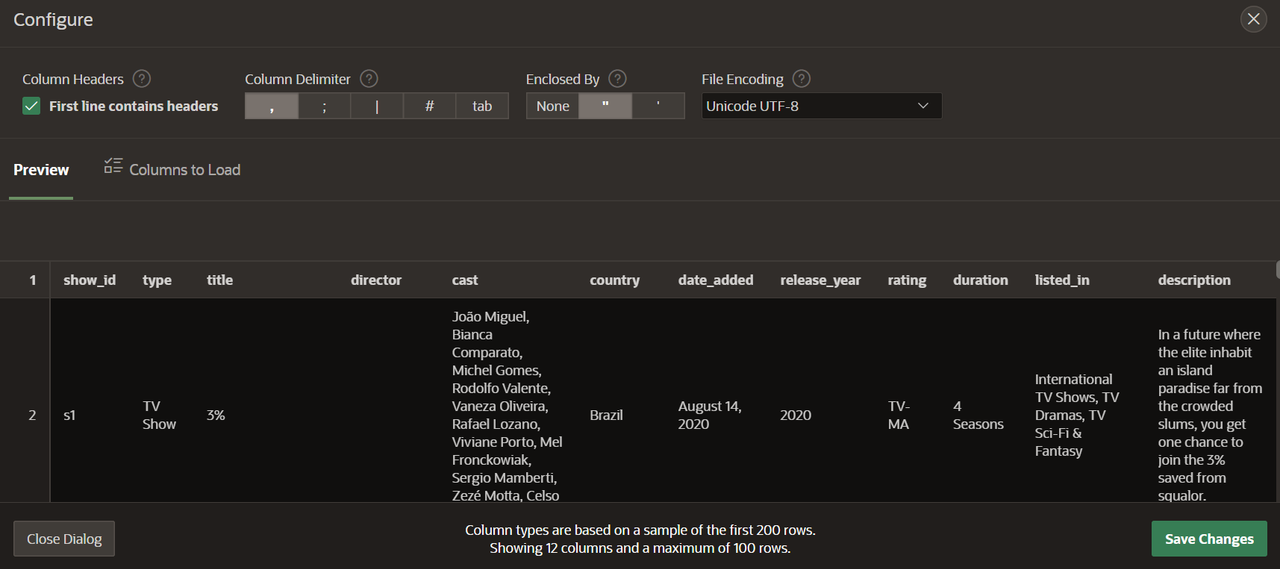
Since our spreadsheet has characters that may not be compatible with some file encoding formats, do not forget to click the Configure button and update the File Encoding to UTF-8.
-
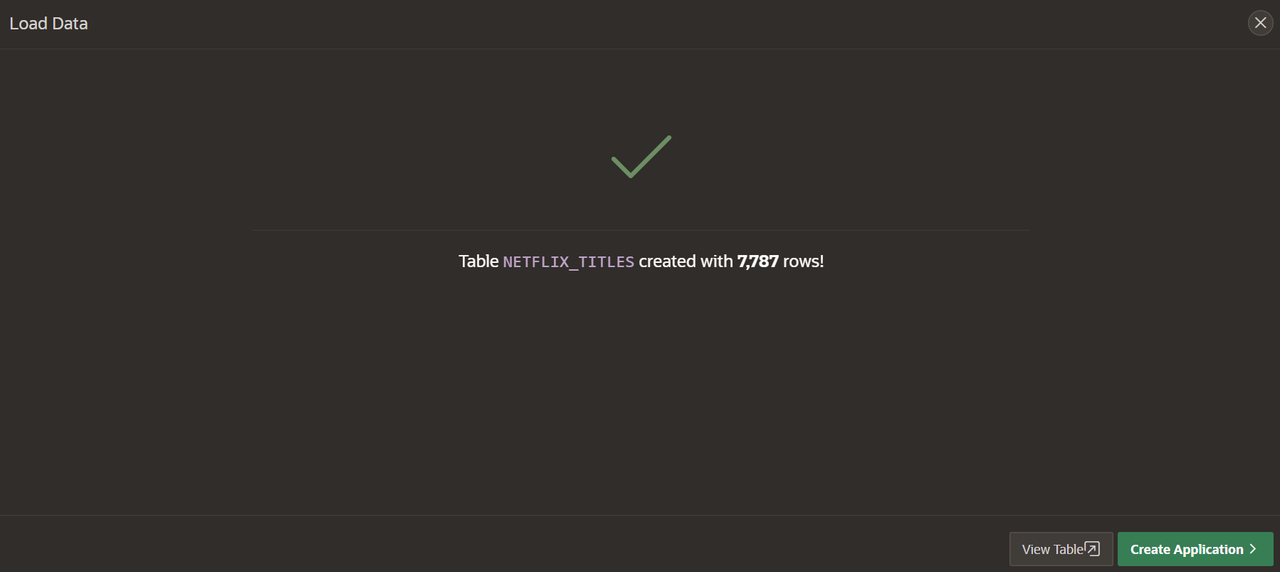
Now you can Save Changes and Load Data. This will create a database table based on the spreadsheet data, with every row now available on the NETFLIX_TITLES table.
-
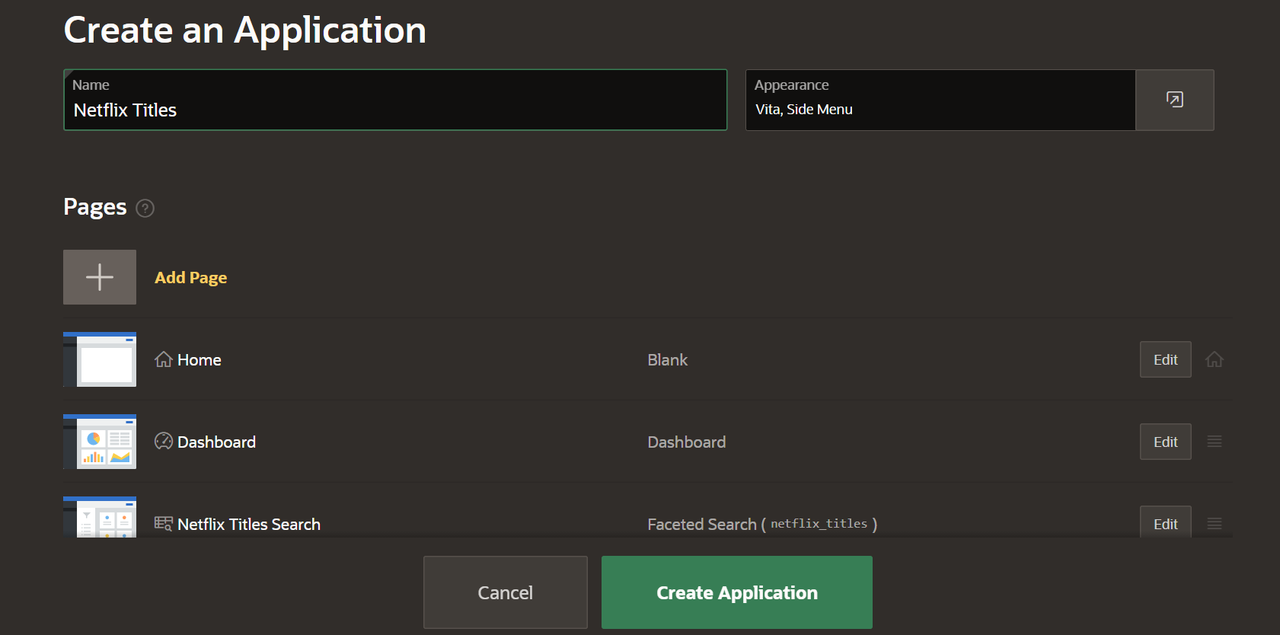
Click the Create Application button to automatically generate an Application based on this table. Oracle APEX will suggest an App Name, Appearance Theme and Web Pages that match our data. We will just click Create Application once again.
-
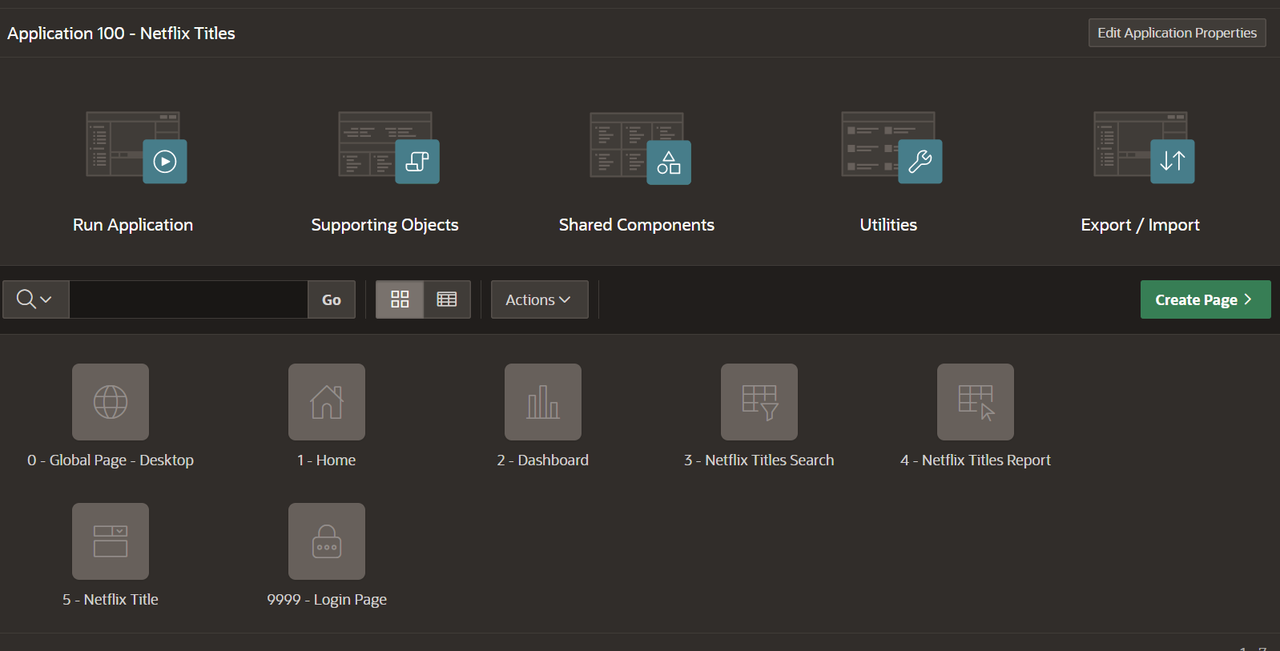
Our application is now ready, let's take some time to understand how the pages work, and how to edit any Item on an APEX page.
After creating our first application and automatically generating some Reports, it is time to study some of the available reports and create some examples:
-
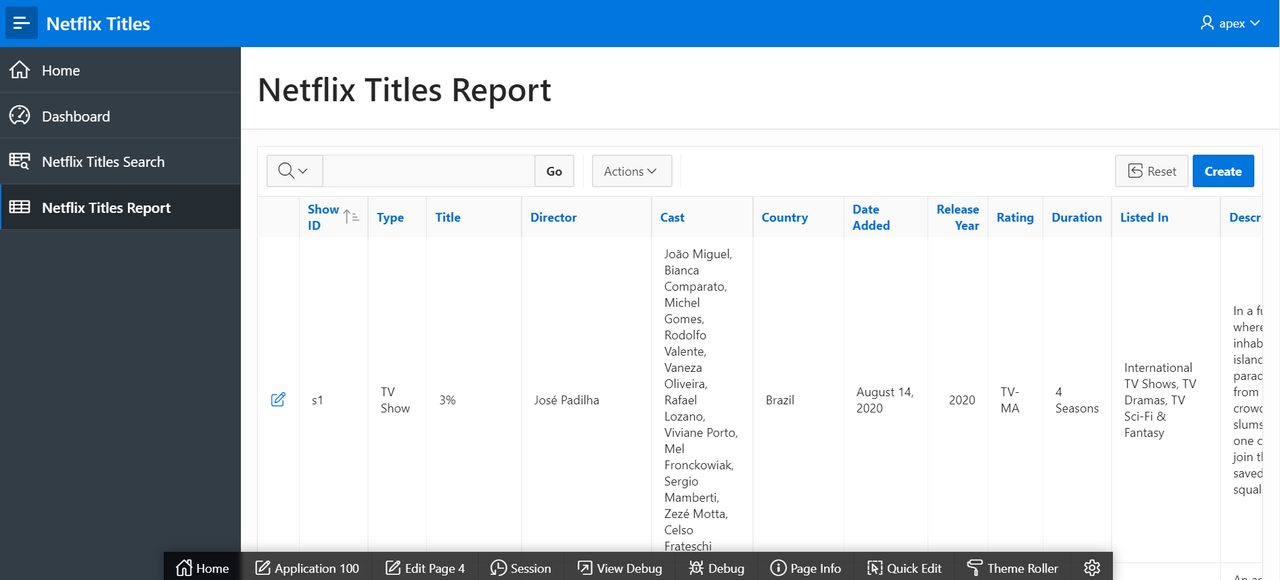
First of all, access the Netflix Titles Report (Page 4) on your APEX Application and click on Edit Page 4 on the bar located on the bottom of your screen.
-
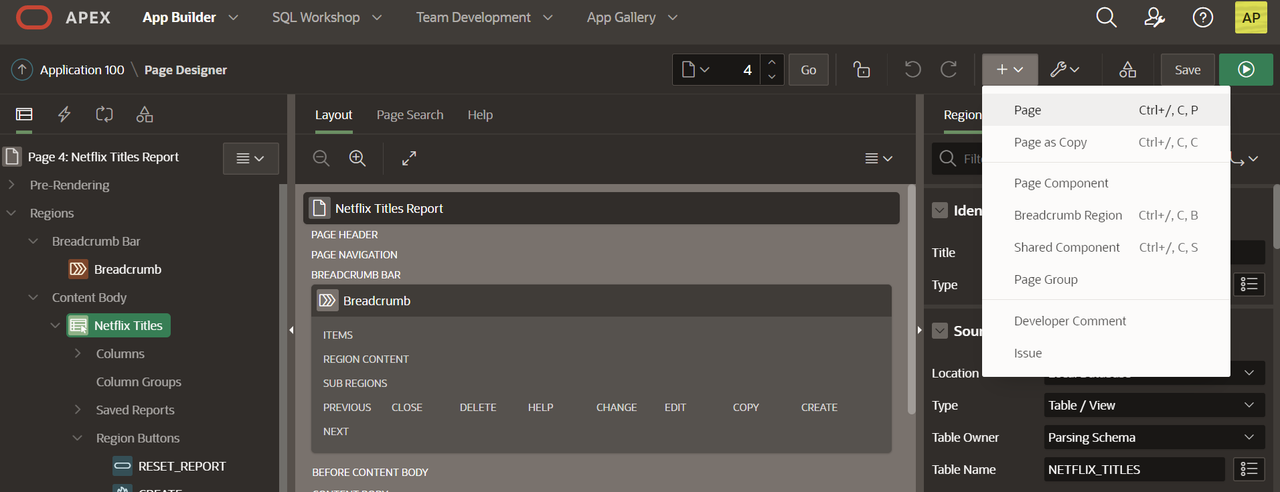
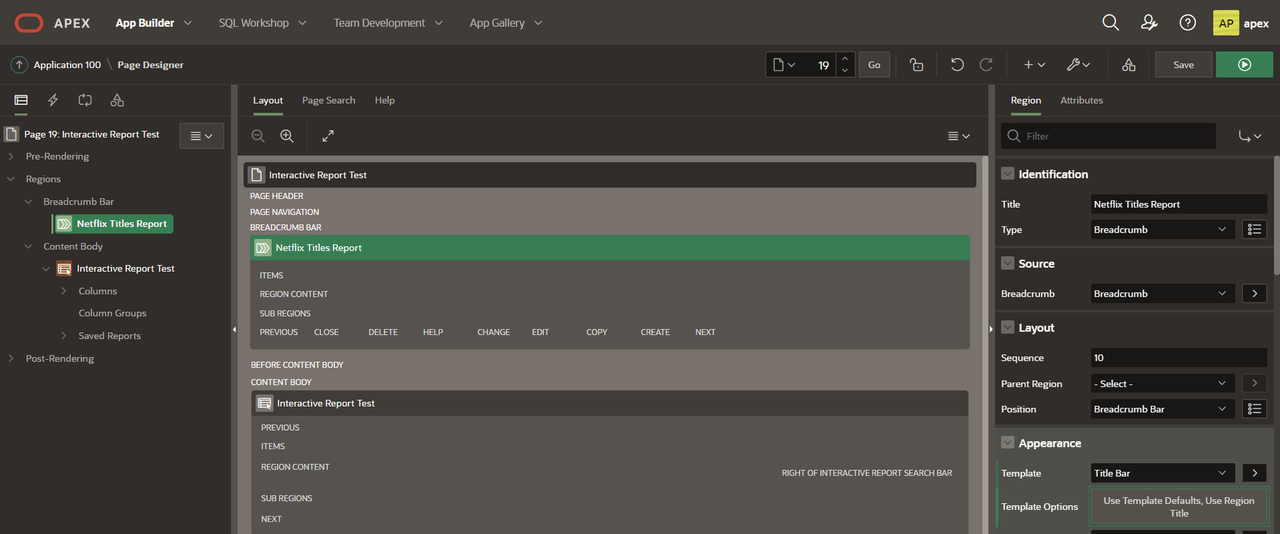
Click on Netflix Titles inside the Content Body (left-side of your screen) and navigate the Region area to find out which kind of report was used to create this page. On the screenshot below you can see it was an Interactive Report.
-
Find the + Button on the upper-right and select the option Page to create a new page on the same APEX Application.
-
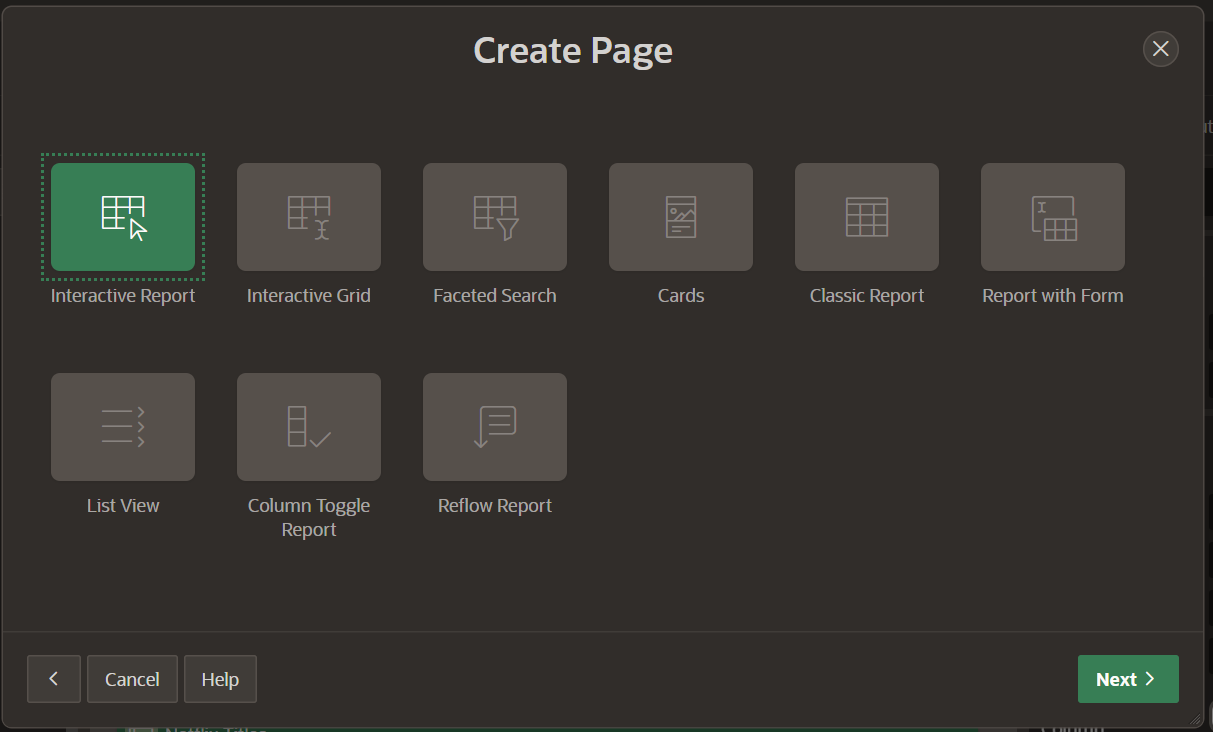
Select Report > Interactive Report
-
Define a name to the new page, click Next.
Choose 'Create a new navigation menu entry' and name your new page
-
Refer to the table NETFLIX_TITLES, created when the spreadsheet was loaded to our APEX Services. You can include every column from the table to our Interactive Report. This means every column will be loaded to our webpage, but not necessarily displayed, as we will see in the next examples. Click Create to finish the Report creation process.
-
The new Netflix Report Page is created. Run it and compare the main differences between the Page 4 and our new Page. There is a Title and 2 buttons 'missing'.
-
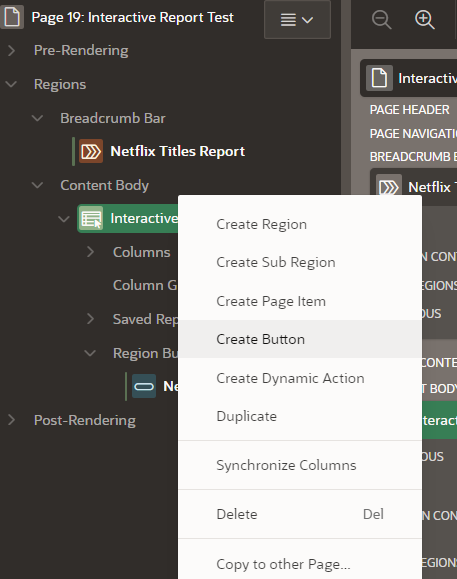
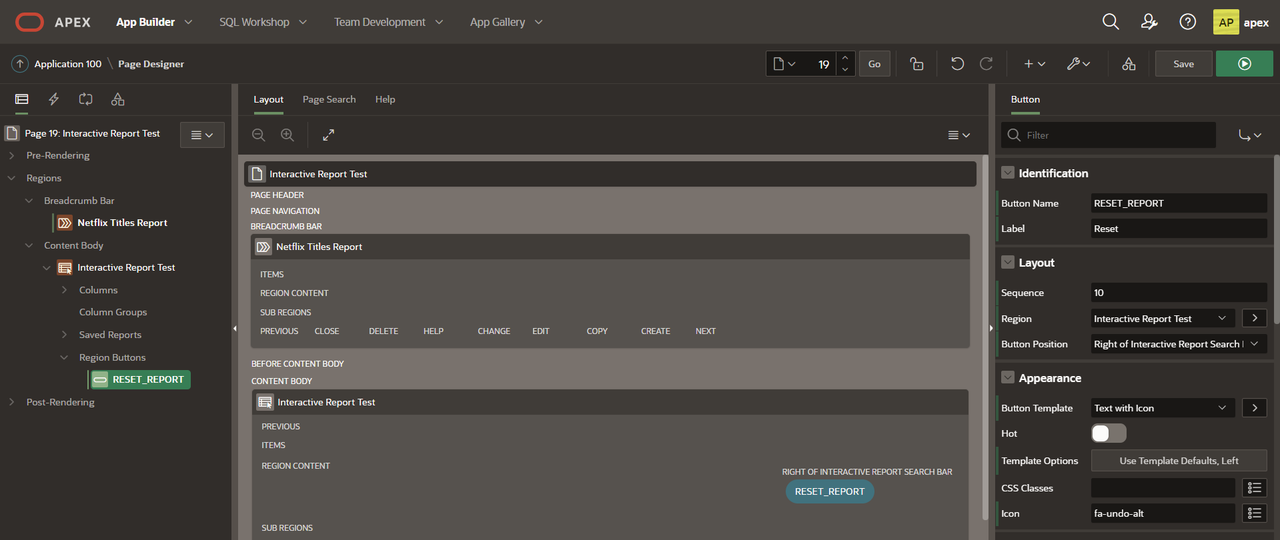
Create a Title and the Buttons (just the visuals for now, no Actions required)
-
After understanding some basics on Reports, you can delete this Page. Everything done so far on this page will be lost: Every Report, Button and Action, even the Navigation Menu Entry. So be careful when deleting your pages.
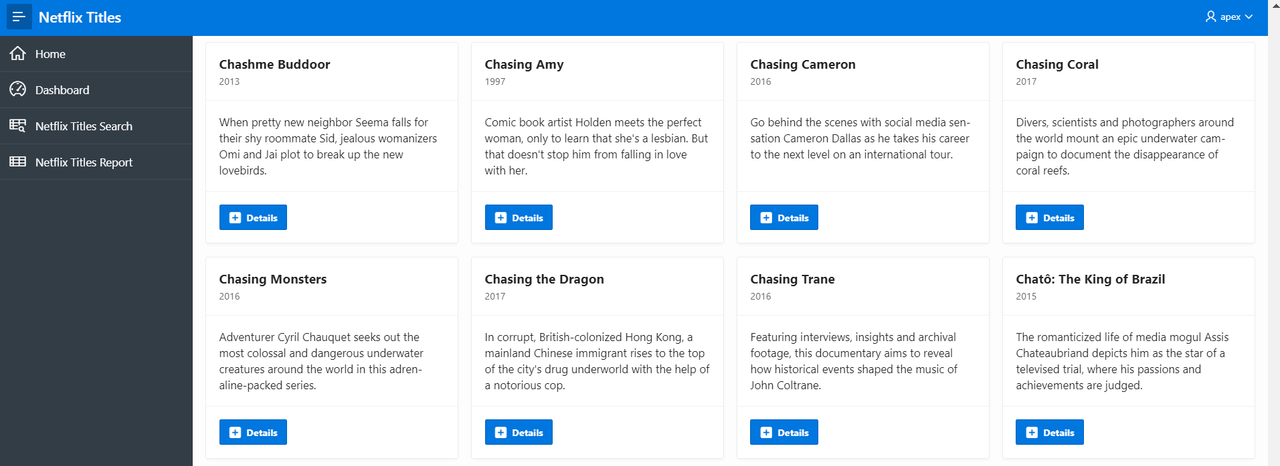
After mimicking an already created Report, I believe it is time to create a brand-new one, and build it from an idea. What about a Movie Catalog? Displaying every title and with buttons to display Additional Info to the user if he is interested in the movie. It could look like this:
-
First of all, we are going to create a new Page/Report. Go to Create a Page, choose the Report option, select Cards and follow the usual process, Creating a new navigation Menu Entry. In the Report Source step, select SQL Query as our Source Type and write down the SQL Query below:
SELECT ID,
       SHOW_ID,
       TYPE,
       TITLE,
       DIRECTOR,
       CAST,
       COUNTRY,
       DATE_ADDED,
       RELEASE_YEAR,
       RATING,
       DURATION,
       LISTED_IN,
       DESCRIPTION
  FROM NETFLIX_TITLES
-
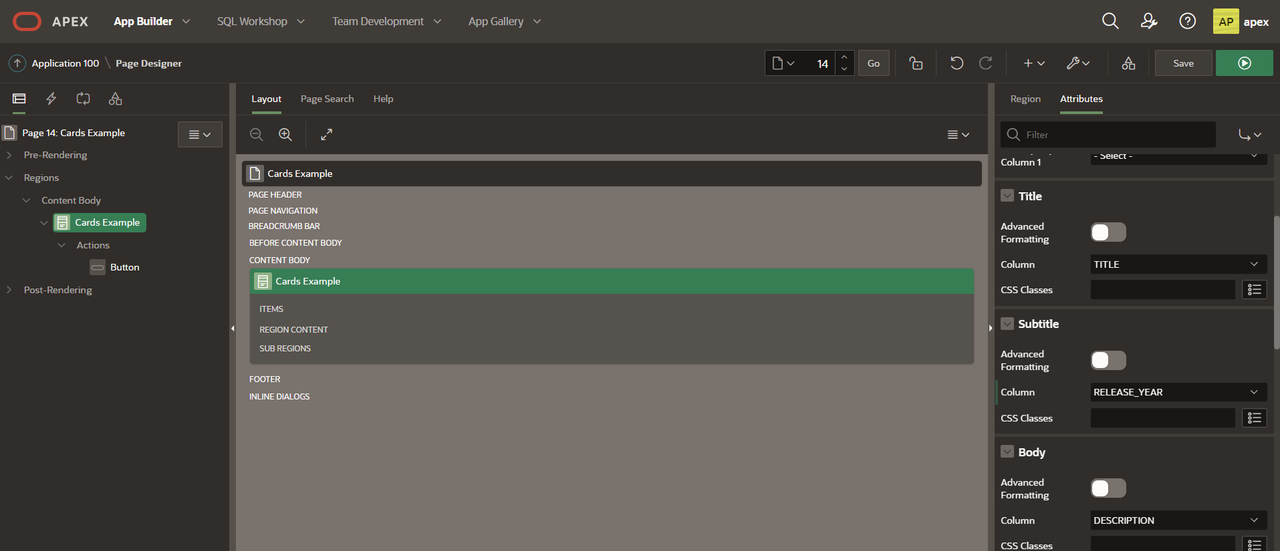
In the last step, select Grid, TITLE as your Title Column and DESCRIPTION as your Body Column.
-
Edit your Report and under Attributes change Subtitle to RELEASE_YEAR
-
Under Actions, Right-click and select Create Action. Your new action will be a button. Name it Details.
-
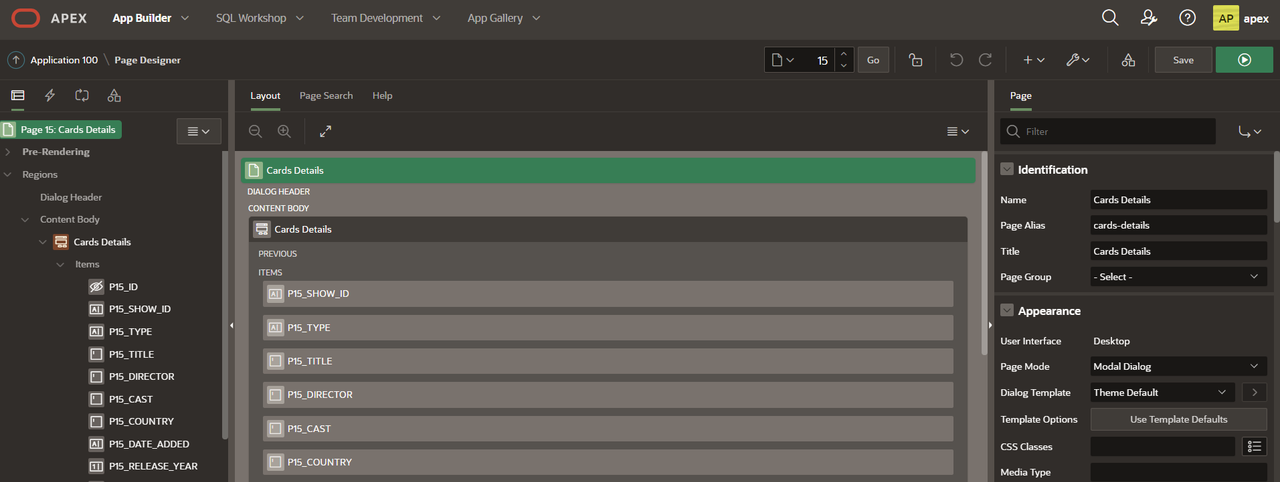
We want this button to load all the details about the page. We can do it using a Form. Create a Page > Form > Form. Set Page Mode to Modal Dialog. Branch Here on Submit and Cancel and Go To Page should both be your Cards' Page number. Do not associate this page with a navigation menu entry. Data Source is the same SQL Query. Select ID as your Primary Key Column.
Result page should look like this:
-
Go back to the Cards Page and edit the button to take the user to the Form Page. Click in the Button > Action > Link, set Type to Redirect to Page in this Application. set your Form Page as Target, and pass the ID through the Target (see image).
In my example Name is P5_ID and Value is &ID. It means I am sending the ID of the movie to be opened as the ID of the movie in the next page. If we don't do that, clicking the Details Button won't bring any extra detail, since there will be no link to the selected movie.
-
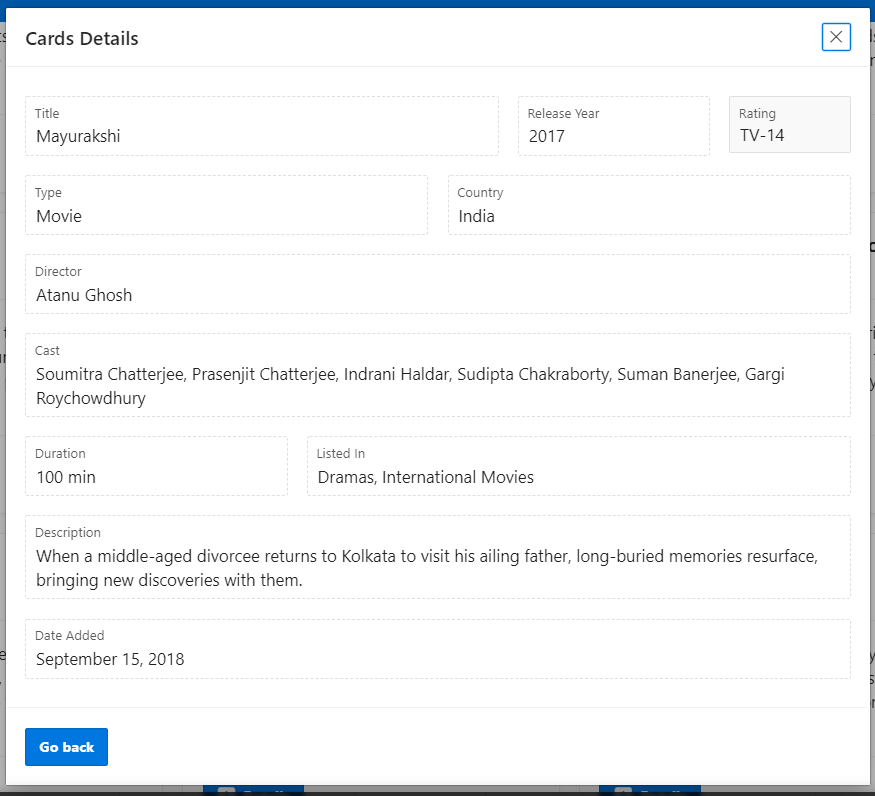
Update the Form to make it look like you want. I removed every button but the Cancel one (renamed as Go Back), and set every field as Display Only, besides of resizing it to better fit the screen. Edit Page and final result should look like this:
From now on we are not working with the Netflix Titles Example anymore. We are going to use another example, simulating a Non-Governmental Organization (NGO) that uses Oracle APEX to manage its activities.
-
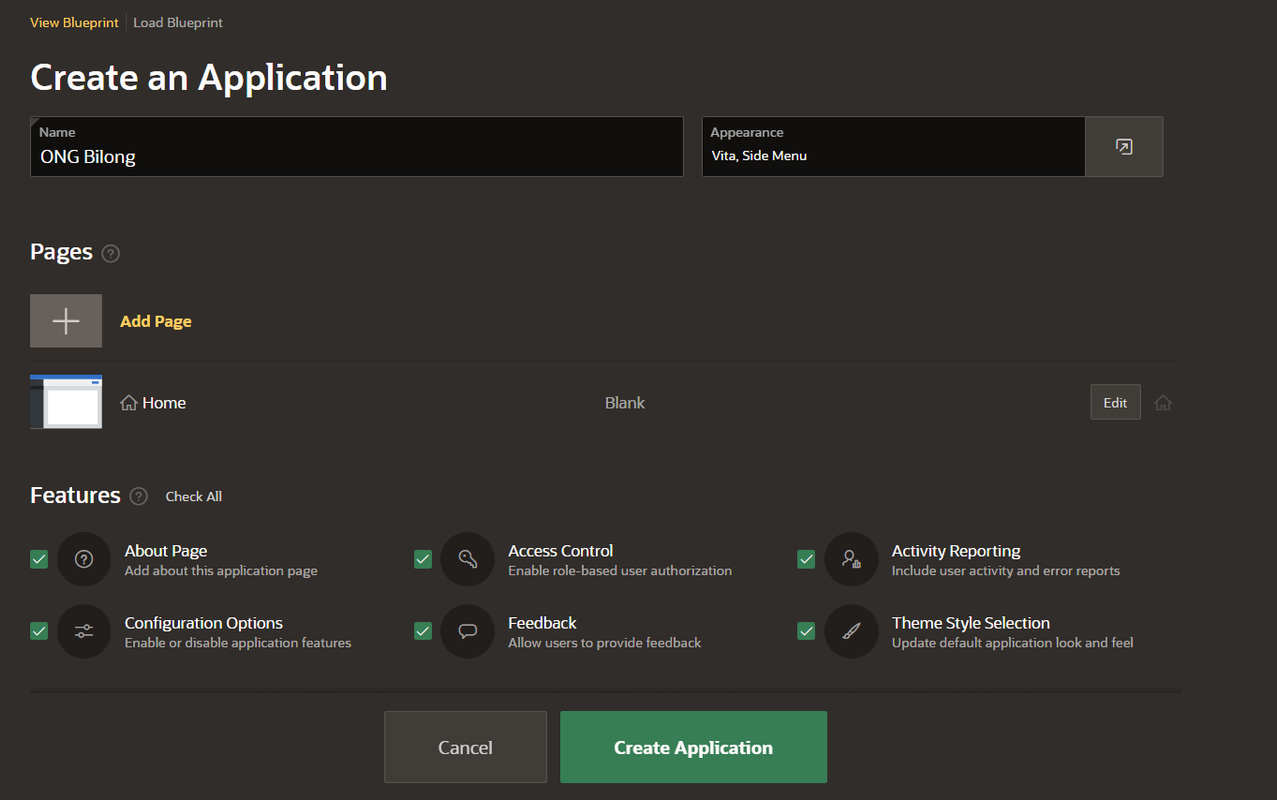
Log into your APEX Environment and Create an Application. Name it with any name but do not forget to enable every single one of the available Features. You can leave the default for all the remaining settings.
-
Since we haven't loaded any spreadsheet, there is no table with data that could be used to our example, so let's design and create such tables:
My suggestion is using 2 tables: one for Events and other for Donations.
-
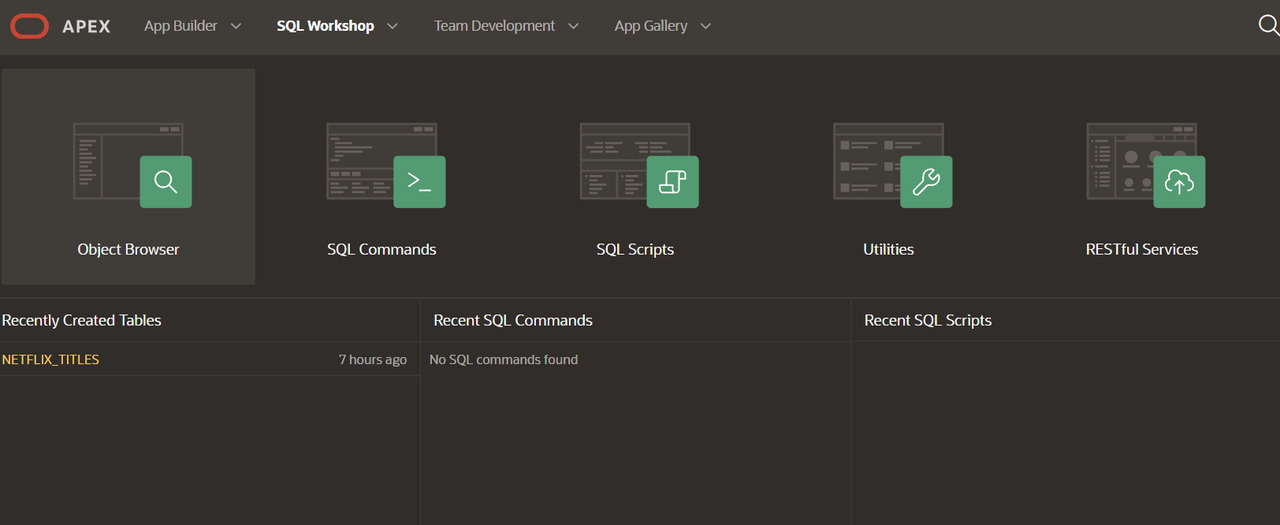
We can use the SQL Workshop area to interact directly with the Database
-
Open the Object Browser
-
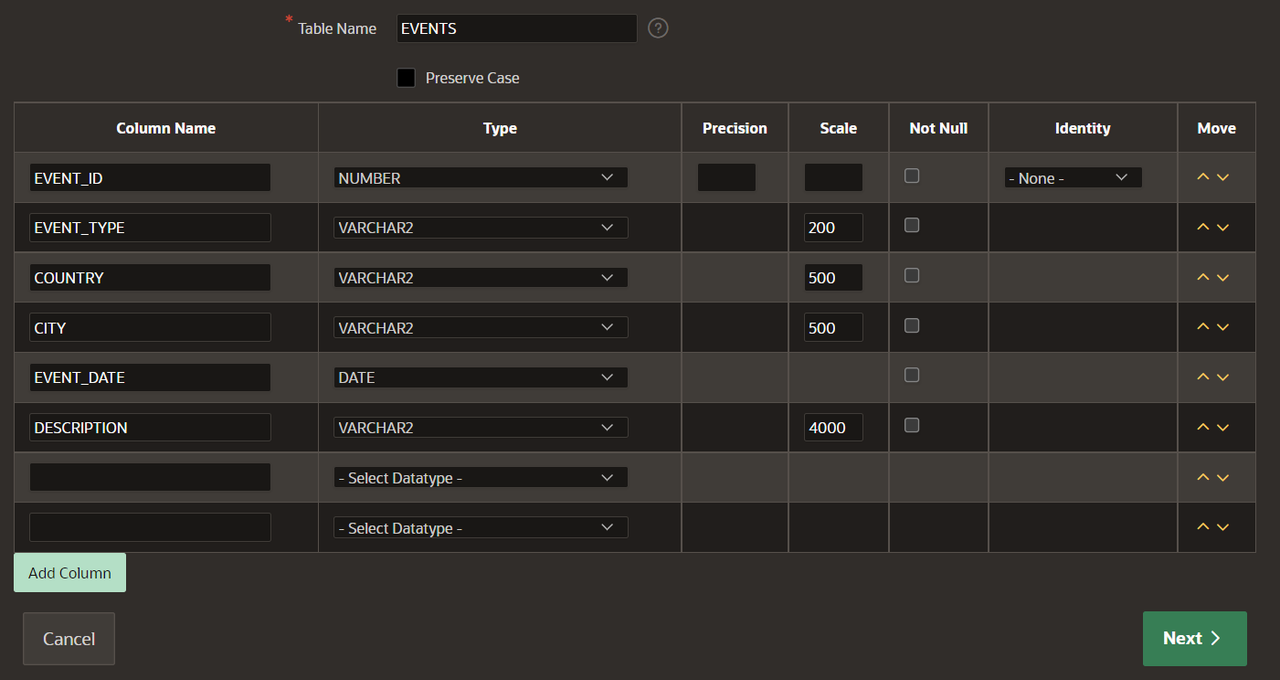
Create both tables following the suggested Data Types. Begin creating the EVENTS table, and set the EVENTS_ID as your Primary Key. Then proceed to creating the DONATIONS table with ATTENDEE_ID as your Primary Key and EVENT_ID as a Foreign Key. You can also find the SQL for both tables below:
CREATE table "EVENTS" (
    "EVENT_ID"    NUMBER,
    "EVENT_TYPE"  VARCHAR2(200),
    "COUNTRY"     VARCHAR2(500),
    "CITY"        VARCHAR2(500),
    "EVENT_DATE"  DATE,
    "DESCRIPTION" VARCHAR2(4000),
    constraint  "EVENTS_PK" primary key ("EVENT_ID")
)
/

CREATE sequence "EVENTS_SEQ"
/

CREATE trigger "BI_EVENTS"
  before insert on "EVENTS"
  for each row
begin
  if :NEW."EVENT_ID" is null then
    select "EVENTS_SEQ".nextval into :NEW."EVENT_ID" from sys.dual;
  end if;
end;
/
CREATE table "DONATIONS" ( "ATTENDEE_ID" NUMBER, "EVENT_ID" NUMBER, "FIRST_NAME" VARCHAR2(200), "LAST_NAME" VARCHAR2(200), "EMAIL" VARCHAR2(500), "CREDIT_CARD" NUMBER, "CREDIT_CARD_TYPE" VARCHAR2(200), "DONATION_AMOUNT" NUMBER, constraint "DONATIONS_PK" primary key ("ATTENDEE_ID") ) / CREATE sequence "DONATIONS_SEQ" / CREATE trigger "BI_DONATIONS" before insert on "DONATIONS" for each row begin if :NEW."ATTENDEE_ID" is null then select "DONATIONS_SEQ".nextval into :NEW."ATTENDEE_ID" from sys.dual; end if; end; / ALTER TABLE "DONATIONS" ADD CONSTRAINT "DONATIONS_FK" FOREIGN KEY ("EVENT_ID") REFERENCES "EVENTS" ("EVENT_ID") / -
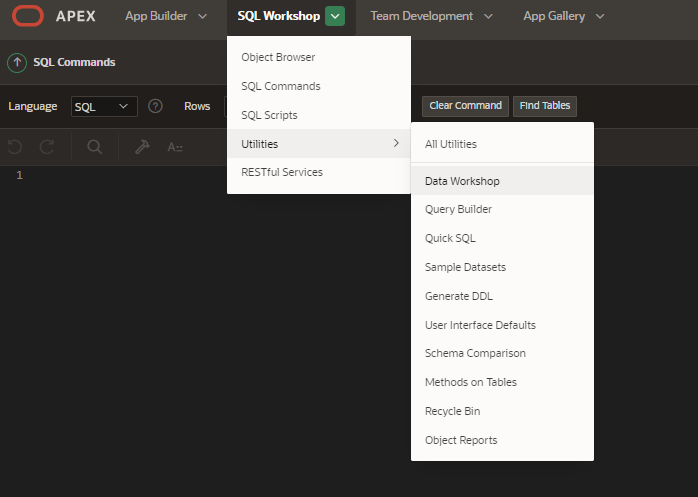
Once your tables are created you can load the data into it using the SQL Workshop > Utilities > Data Workshop. There are also a lot of other tools you can explore when working with your data.
-
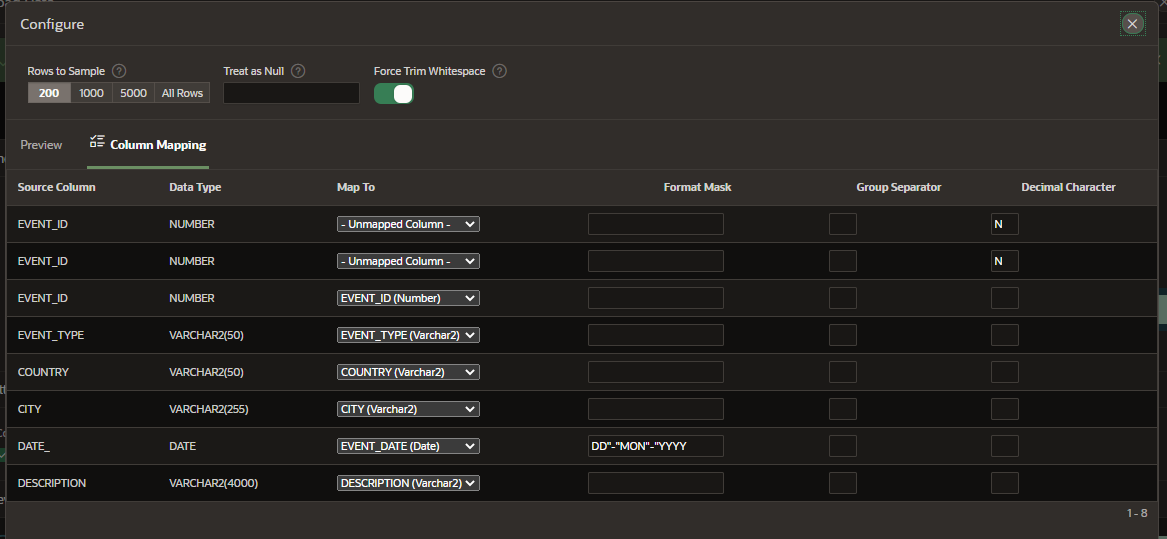
Choose the Load Data option and Copy and Paste the files shared with you in the beginning of this training session (NGO_Events.xlsx and NGO_Donations.xlsx). Do not forget to map your columns, check the First line contains headers button and set File Encoding to UTF-8. I also had to define Format Mask manually to DD"-"MON"-"YYYY.
Events should load 77 rows and Donations 972 rows.
-
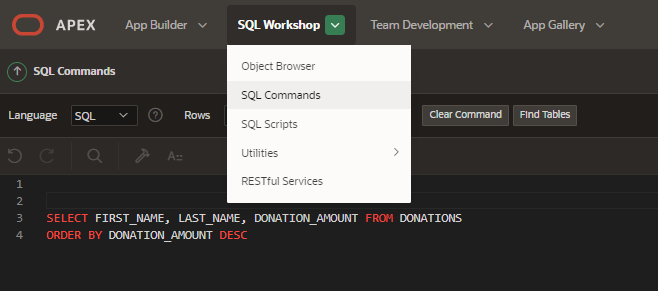
Enter the SQL Workshop > SQL Commands Tab and play around with some of the SQL Queries below:
-- BIGGEST DONATIONS
SELECT FIRST_NAME, LAST_NAME, DONATION_AMOUNT FROM DONATIONS
ORDER BY DONATION_AMOUNT DESC

--IDENTIFY EVENTS IN MEXICO
SELECT * FROM EVENTS
WHERE COUNTRY = 'Mexico'
ORDER BY EVENT_ID

--FIND OUT TOTAL DONATIONS FROM SAN ISIDRO'S BAZAAR
SELECT SUM(DONATION_AMOUNT) FROM DONATIONS
WHERE EVENT_ID = 10
/

--CREATE AN 'EVENT OFFICIAL NAME' TO SAN ISIDRO'S BAZAAR
SELECT CITY||'''s '||EVENT_TYPE as EVENT, COUNTRY FROM EVENTS
WHERE EVENT_ID = 10

--FIND OUT THE EVENTS WITH THE HIGHER TOTAL DONATIONS
SELECT CITY||'''s '||EVENT_TYPE as EVENT, COUNTRY, SUM(DONATION_AMOUNT) FROM DONATIONS
LEFT OUTER JOIN EVENTS
ON EVENTS.EVENT_ID = DONATIONS.EVENT_ID
GROUP BY CITY||'''s '||EVENT_TYPE, COUNTRY
ORDER BY SUM(DONATION_AMOUNT) DESC

--CREATE A VIEW BASED ON THIS LAST QUERY
CREATE VIEW DONATION_BY_EVENTS (EVENT,COUNTRY,TOTAL_DONATION) AS
SELECT CITY||'''s '||EVENT_TYPE as EVENT, COUNTRY, SUM(DONATION_AMOUNT) FROM DONATIONS
LEFT OUTER JOIN EVENTS
ON EVENTS.EVENT_ID = DONATIONS.EVENT_ID
GROUP BY CITY||'''s '||EVENT_TYPE, COUNTRY
ORDER BY SUM(DONATION_AMOUNT) DESC

--QUERY YOUR VIEW
SELECT * FROM DONATION_BY_EVENTS
-
Everything is now set, let's get back to Oracle APEX Pages creation.
Let's create an Interactive Report and a Form so any user will be able to check available Events and register new ones.
-
Create an Interactive Report based on the Events Table. Add Breadcrumbs with the Home Page as Parent Entry. You can leave all other options as the default.
-
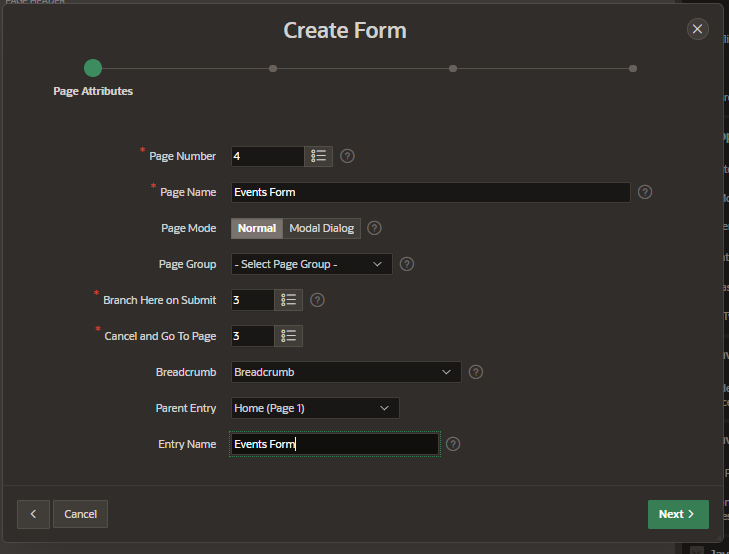
Create a simple Form to include new Events on our database table.
-
Do not forget to set your Primary Key (EVENTS_ID)
-
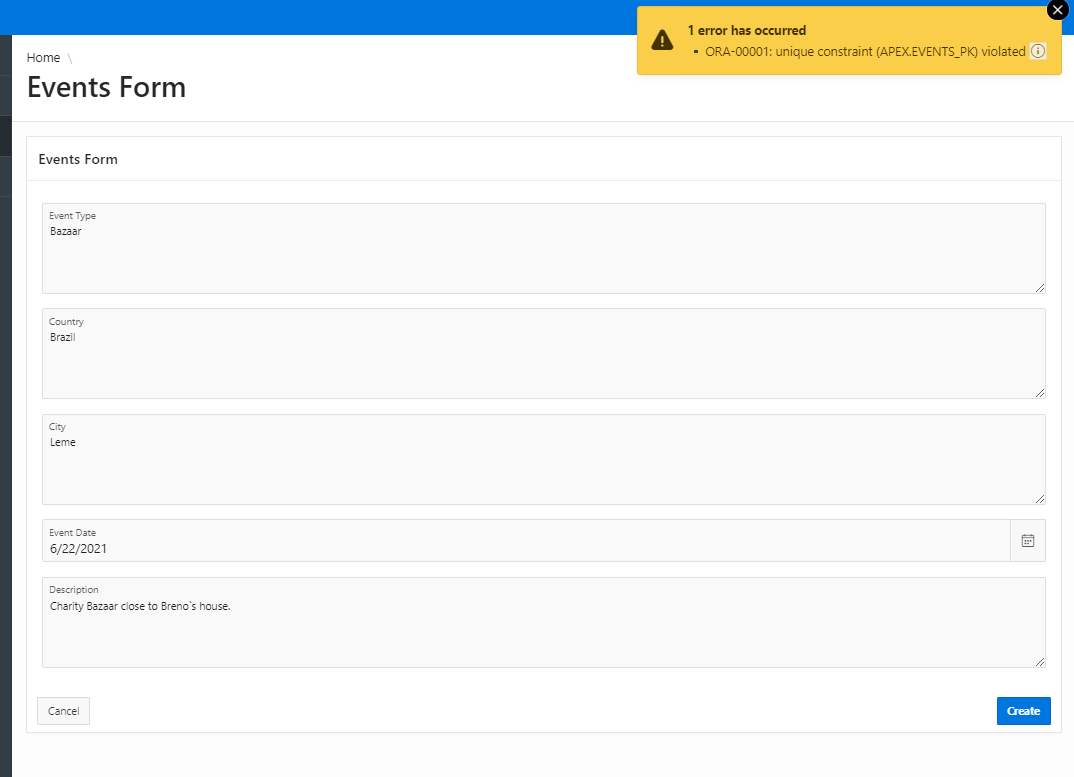
Run your page and try to create a new Event. You will get an error message. This happens because we are not inserting any value into the EVENT_ID column, which happens to be our Primary Key.
-
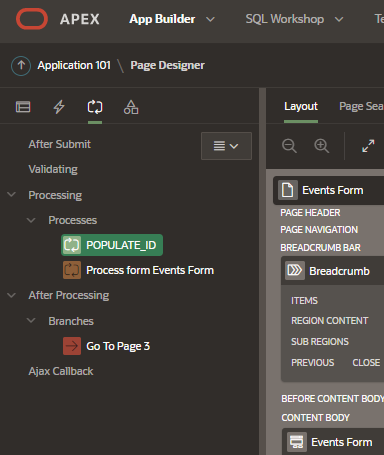
To solve this issue, we are going to create a Process. On the upper-left, click on Processing Tab. Go to Processes and Create Process.
-
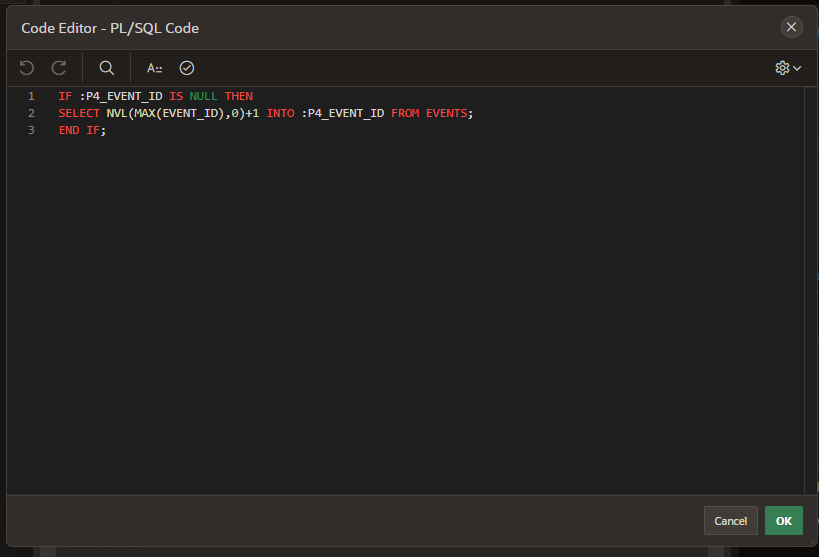
Create a PL/SQL code with the statement: (we could also use a Sequence)
IF :P4_EVENT_ID IS NULL THEN SELECT NVL(MAX(EVENT_ID),0)+1 INTO :P4_EVENT_ID FROM EVENTS; END IF; -
Drag your process to the top of the list and your Form should work perfectly now.
-
Insert some new values to check if it is working properly. In the Screenshot below you can check the newly added records, but the event with ID 78 is not following any rules. We want to prevent this from happening. How could we?
-
Edit P4_EVENT_TYPE to be a Select List (Page Item > Identification > Type), and set the List of Values field as an SQL Query
SELECT DISTINCT EVENT_TYPE as v, EVENT_TYPE as d FROM EVENTS
-
This will limit our Event Type options, so every user will input the same strings when creating a new Event.
-
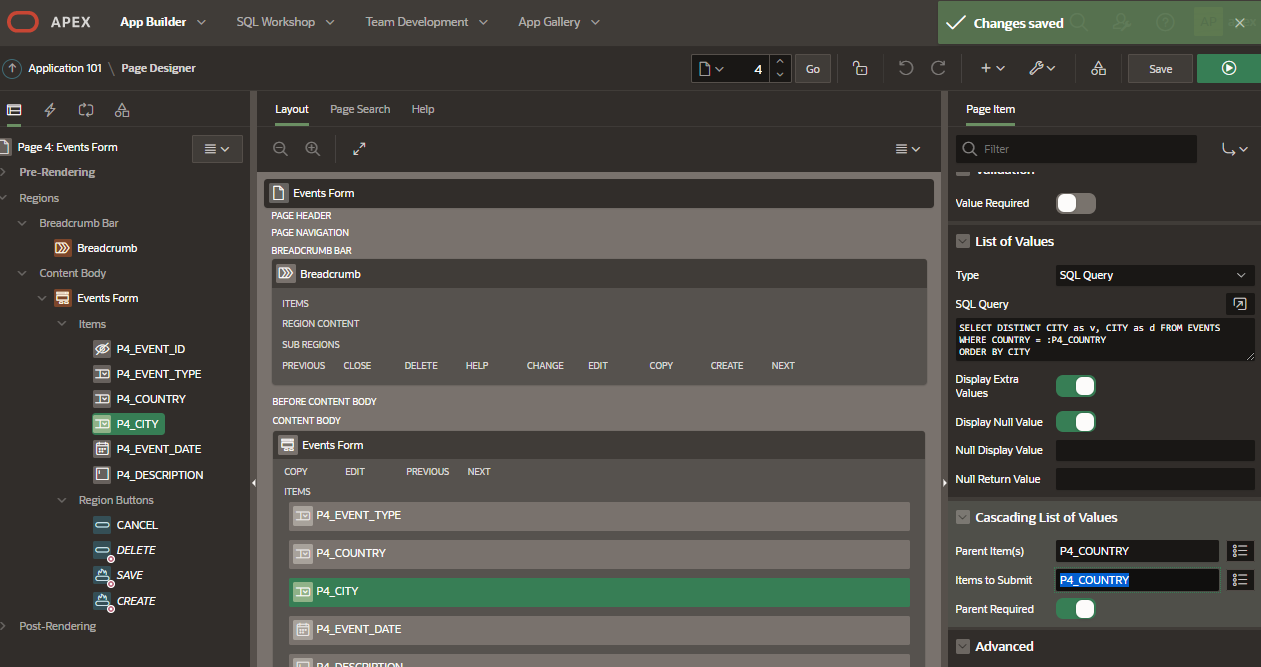
Do exactly the same thing to Country and City, but set City as a Cascading LOV based on Country.
-
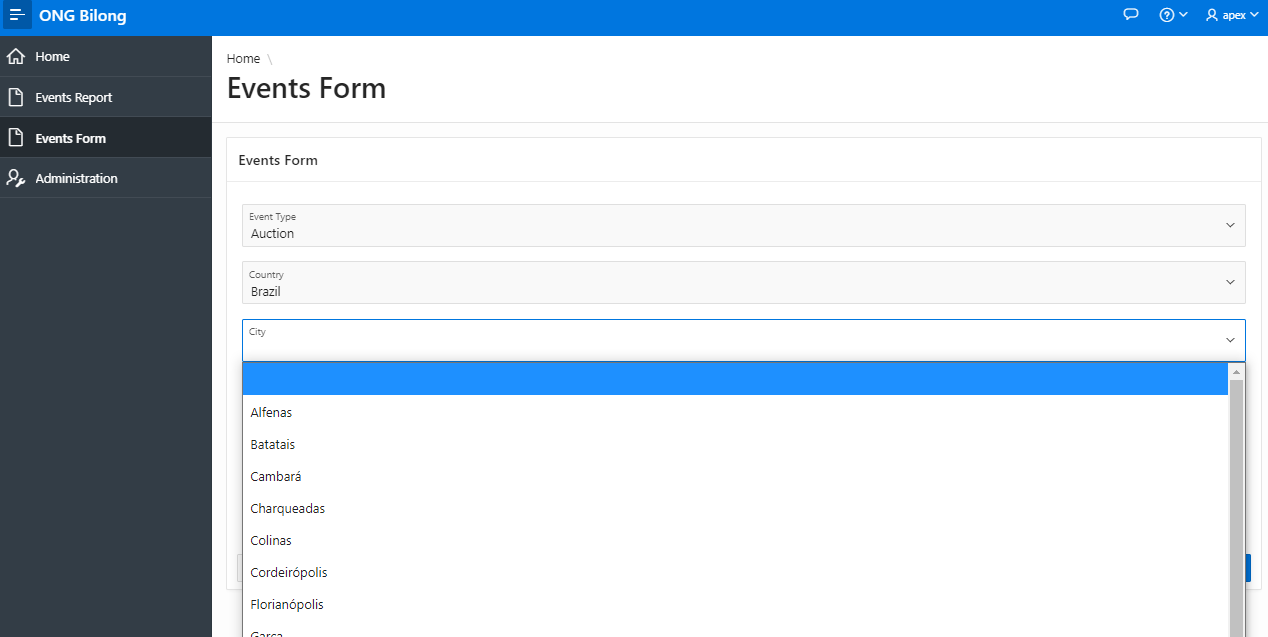
This way the user is only able to select Cities from the selected Country as shown below:
-
Update P4_CITY to Text Field with Autocomplete, since maybe our contributors will register an event in a City that has never hosted any event. Also set Lazy Loading to Yes.
-
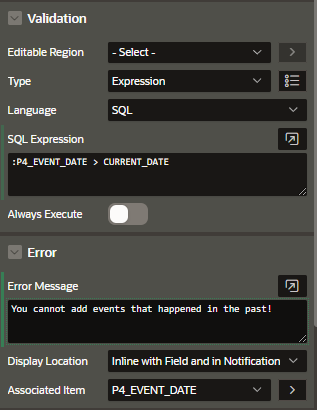
Let's create some validations to avoid some problems when users are adding new Events. Right-click P4_EVENT_DATE > Create Validation.
-
Set the validation expression to allow only dates in the future, and write an error message.
-
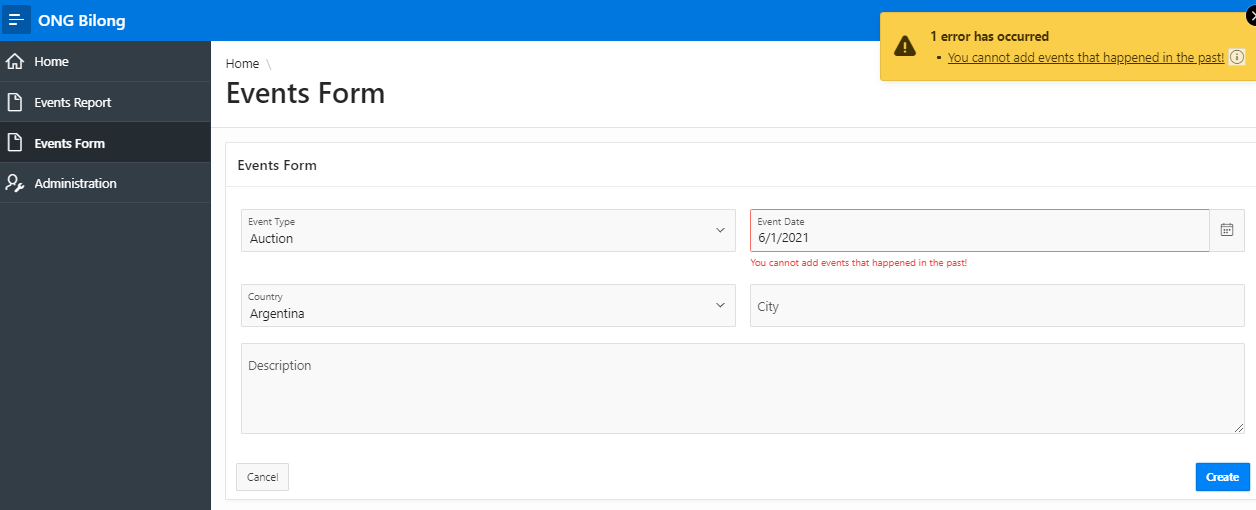
This will happen when any user tries to create an event in the past:
-
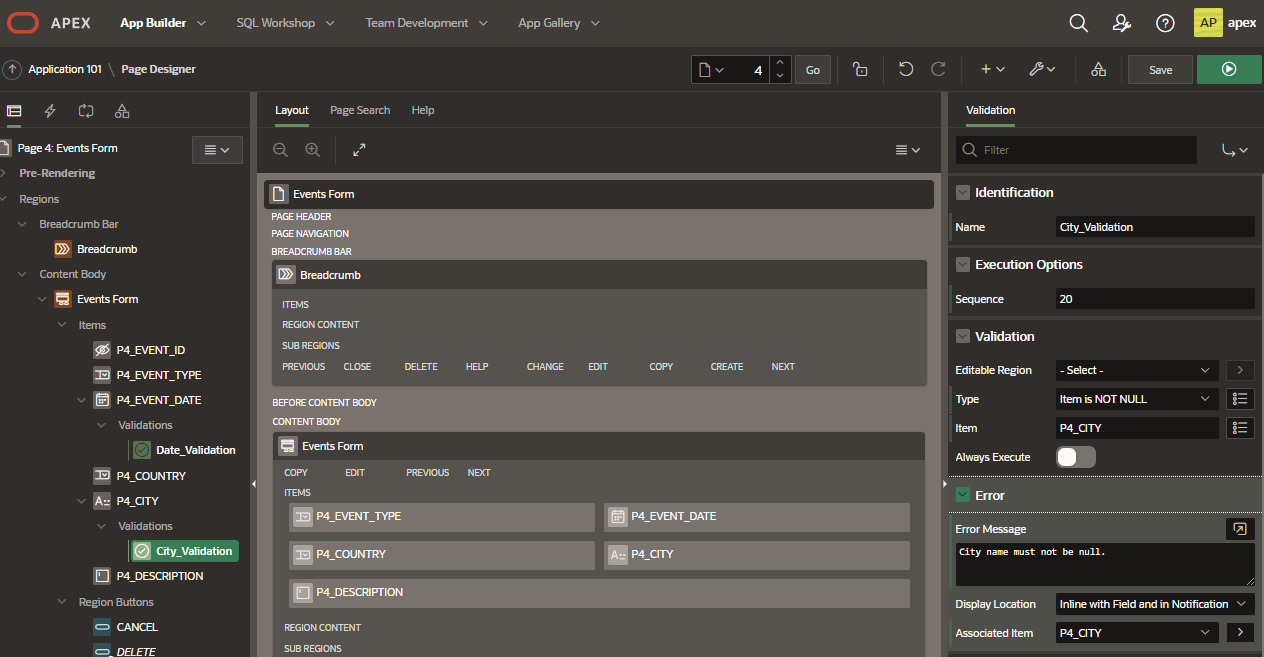
We can also avoid City value from being added as Null.
-
Both errors should show up if it is the case.
-
We have just finished a Form using Validations and Processes, two of the most essential tools when developing with Oracle APEX.
Let's create a calendar to view every Event on our table
-
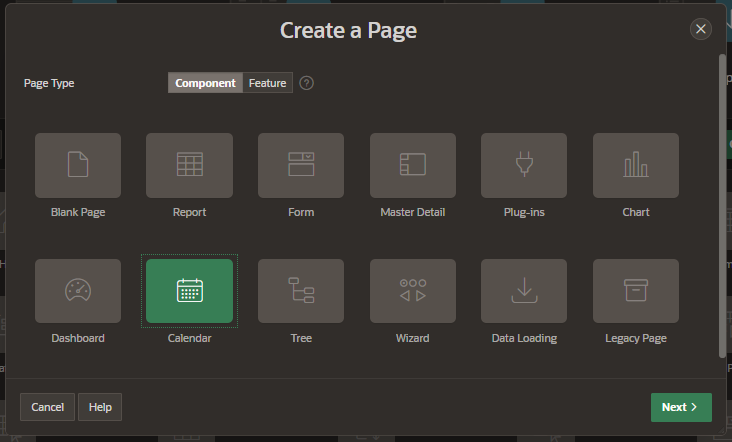
Create a new Page, and select Calendar
-
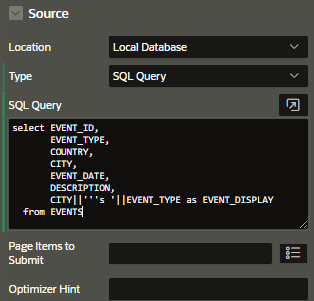
Edit Source > SQL Query and Include a new column called EVENT_DISPLAY.
( CITY||'''s '||EVENT_TYPE as EVENT_DISPLAY )
-
Set it as the Display Column on Attributes > Settings > Display Column
-
You can create a link to the Forms Page on Attributes > Settings > View/Edit Link. Remember that our validation rules prevent the user from editing events that have already happened. We can also add a Create option, which take us to the forms page when clicking in the calendar.
-
Calendar will look like this, if we had START_DATE and END_DATE columns we could add multi-day events.
-
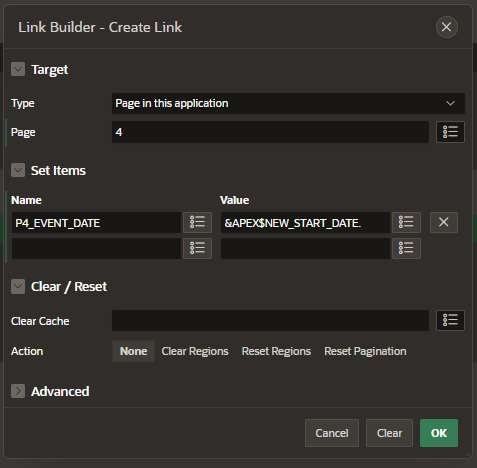
Edit the Create Link option to pass the reference date when creating a new event. This can be done by defining Value as &APEX$NEW_START_DATE. How do we know that? It is available on Oracle Application Express App Builder User's Guide (Section 10.1.5.2 - Editing an Existing Calendar to Include Add and Edit Functionality)
-
Clicking on the calendar will now redirect to the Form page and automatically fill the date.
Until now we are working directly on pages, but we can also edit some stuff that are shared between all pages. An example would be our Navigation Menu, it is something that is available on every page of the application, so we couldn't edit it directly in a page. That's what we call Shared Components, and there is a lot of them.
-
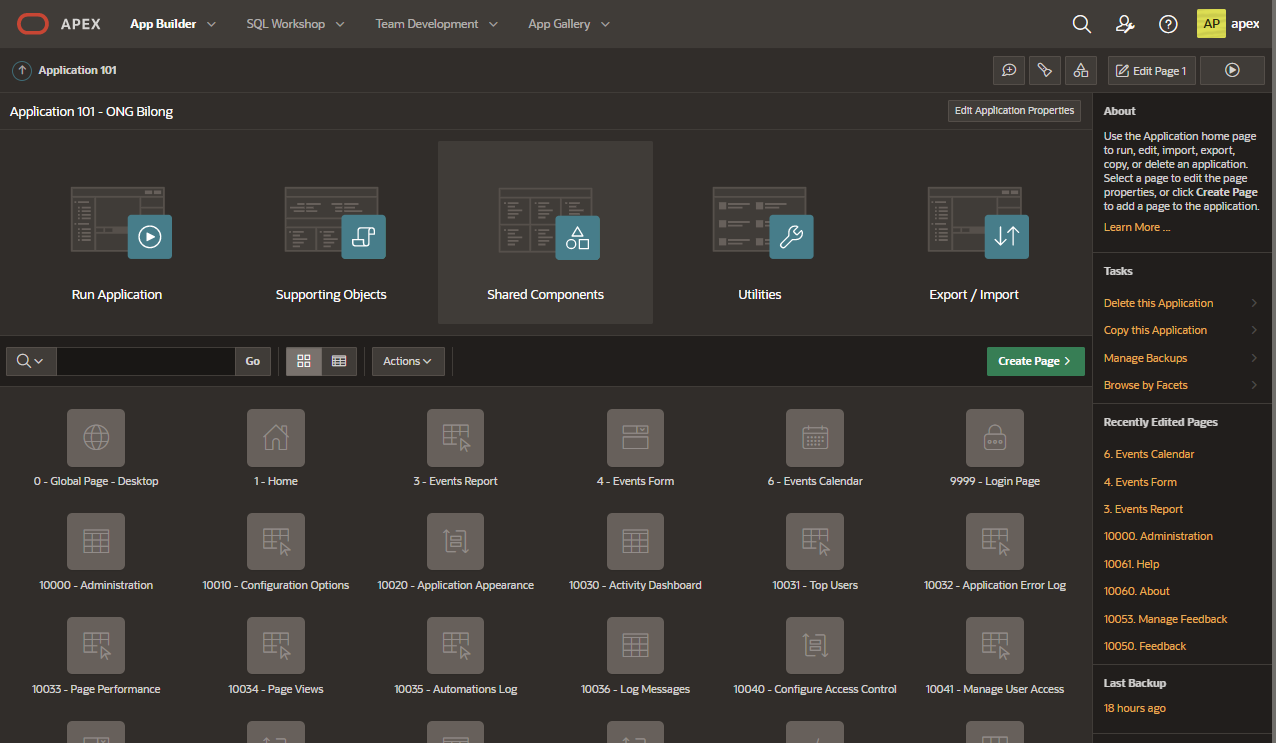
From the APEX Home Page, access App Builder > Shared Components.
-
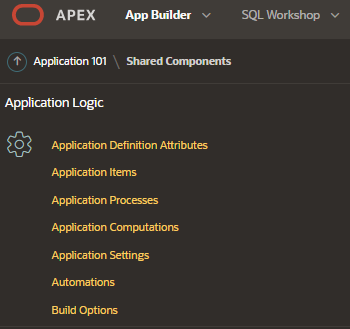
You will find 9 categories: Application Logic, Security, Other Components, Navigation, User Interface, Files, Data Sources, Reports and Globalization.
On Application Definition Attributes you can edit general information about the Application, such as its Name, Aliases and Compatibility Settings.
On Security, take a look on Authentication and Authorization Schemes to define who can access your application and the privileges of these users.
On Other Components we can create custom List of Values, to be queried from our pages (like we did in the Forms we have created).
-
Download and Import the APEX Captcha (1.0) Plug-in into your application, and add it to your Login Page. To do that, you just have to create an Item and set it as Apex Captcha [Plug-In]. All rules and Validations are created automatically. Keep in mind there is a huge library of Plug-ins, and most of the problems you will face were likely solved by other developers and APEX enthusiasts.
-
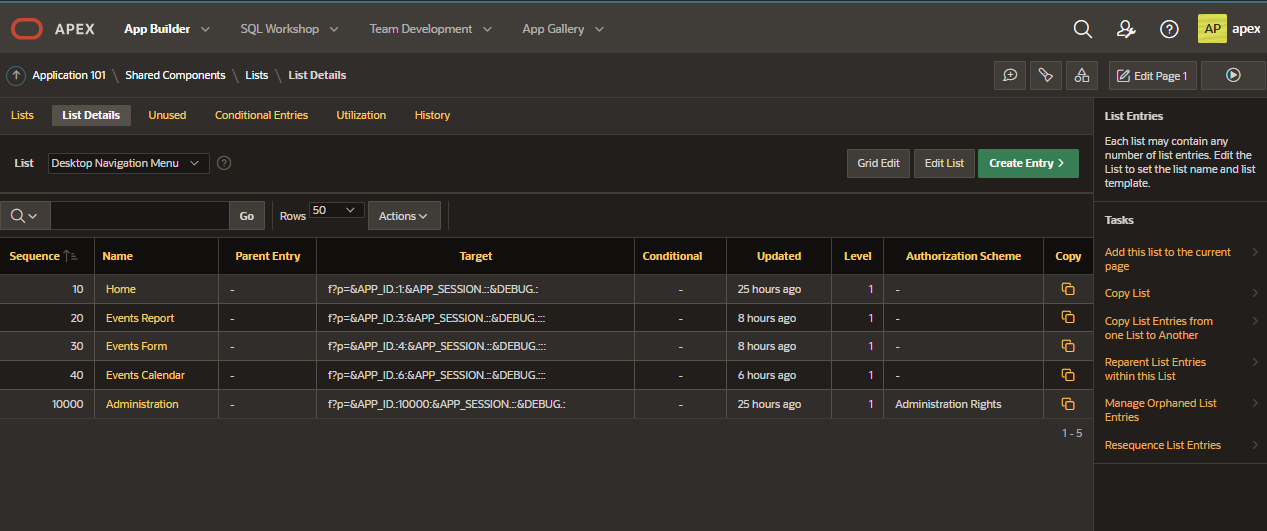
Go back to the Shared Components (there is a link on the upper-right side of every Edit Page). Enter Navigation Menu inside Navigation area. We can control the pages that can be accessed from the Navigation Menu, such as its name, icon and Authorization Schemes (some pages will be available only for Administrators, for example).
-
That's how our Navigation Menu looks like right now:
We could also edit the Breadcrumbs in the Navigation area.
-
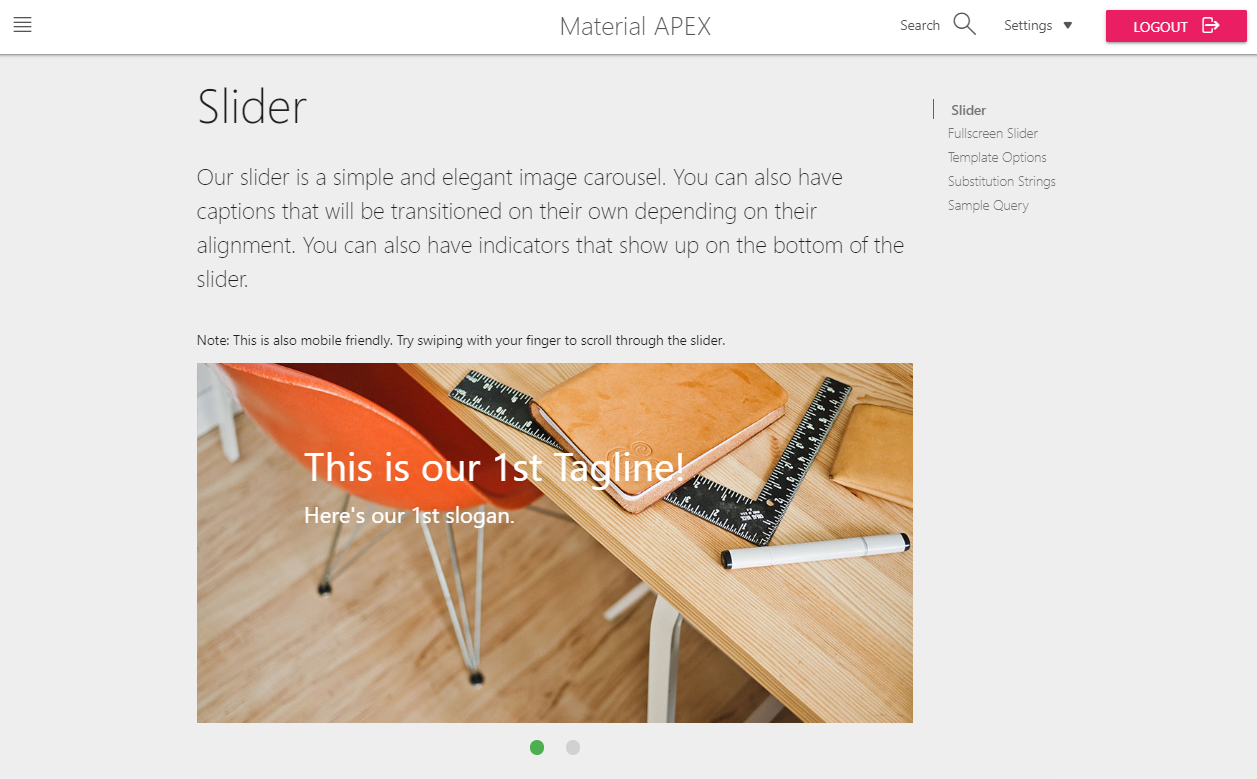
Inside User Interface we can edit the visual aesthetics of the page, from adding a simple "Built with love using Oracle APEX" in the footer of the page, to using a full Theme designed for Oracle APEX. Try to import the Material APEX (material-apex-app-demo). Run the app to check a huge difference on Oracle APEX visuals.
-
The last Shared Component I would like to review here is the Data Load Definitions. But we need a Data Load Wizard before working with that. Do not forget to create it in your NGO Application, and not in the Material APEX one!
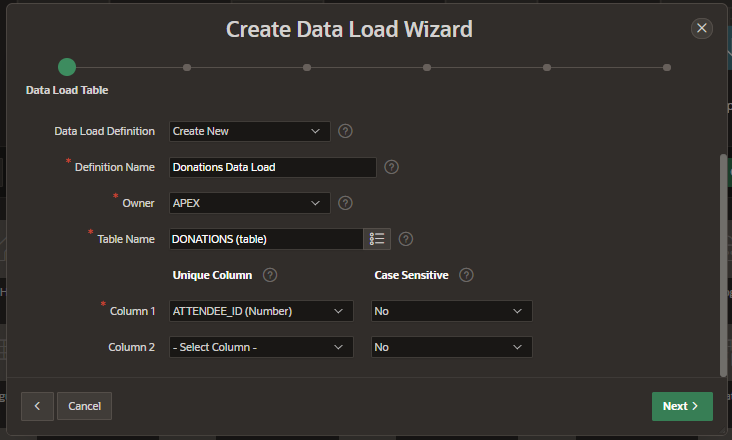
Create a new page in the application and choose Create Data Load Wizard. Write a Definition Name, the Table that will receive the data and its Unique Column (PK).
-
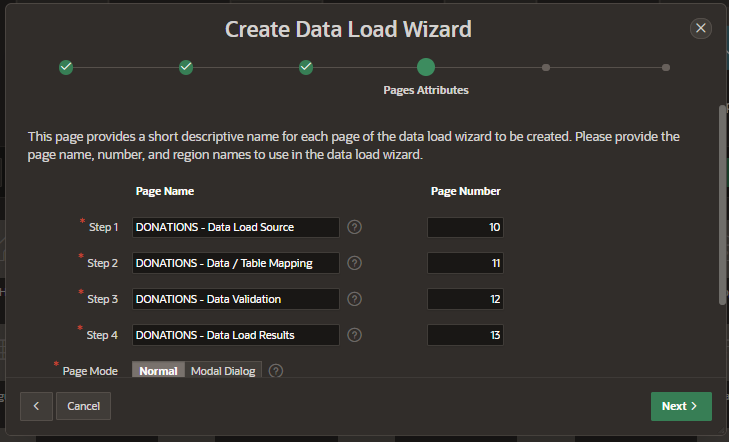
You can create Transformation Rules and Lookups if needed. The Data Load Wizard will create 4 pages that will act as a Wizard. After setting everything up click the Create button.
-
Run the Data Load Page, load the NGO_Donations2.xlsx file, check the mappings and the suggested actions (Insert or Update Row). Click Load Data and check your results.
-
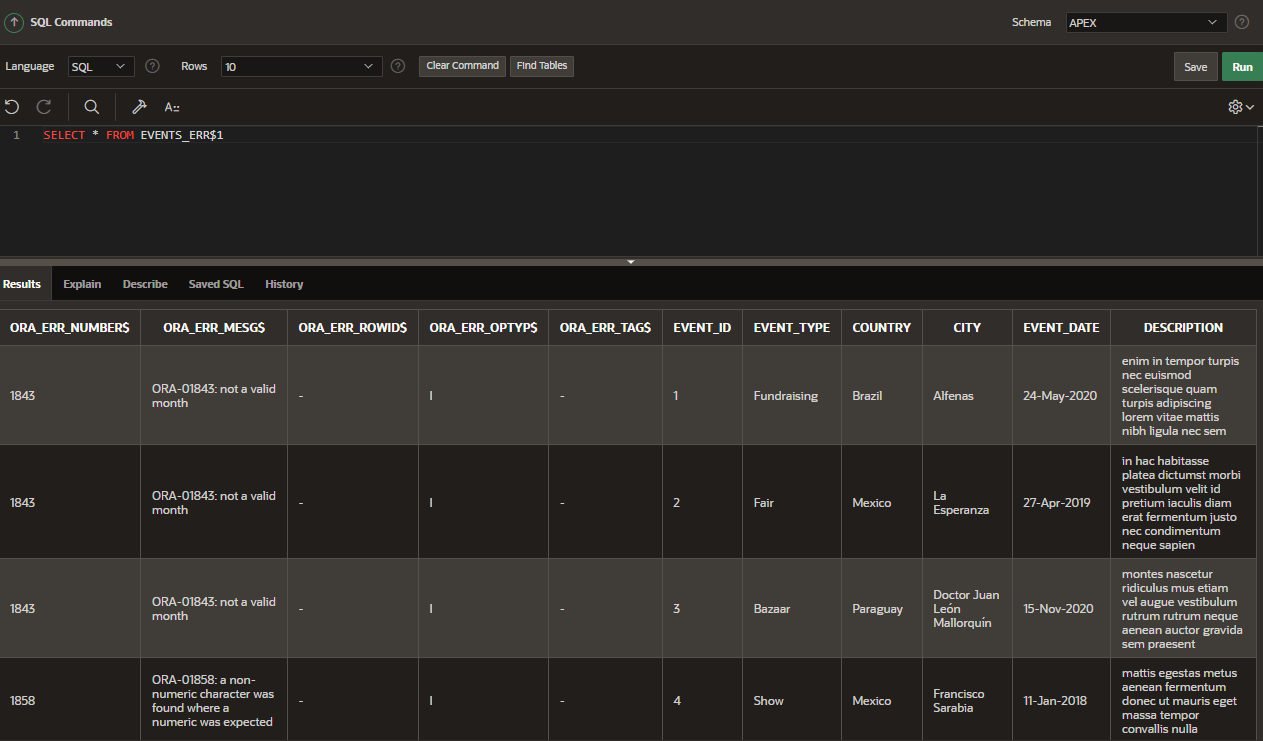
If the number of Inserted/Updated Rows is different from what you expected, and there are Failed Rows, you can always look for Error Tables in Object Browser. In the example below a queried the table EVENTS_ERR$1 after failing to load some rows, and discovered that the problem was related to the Date Format.
-
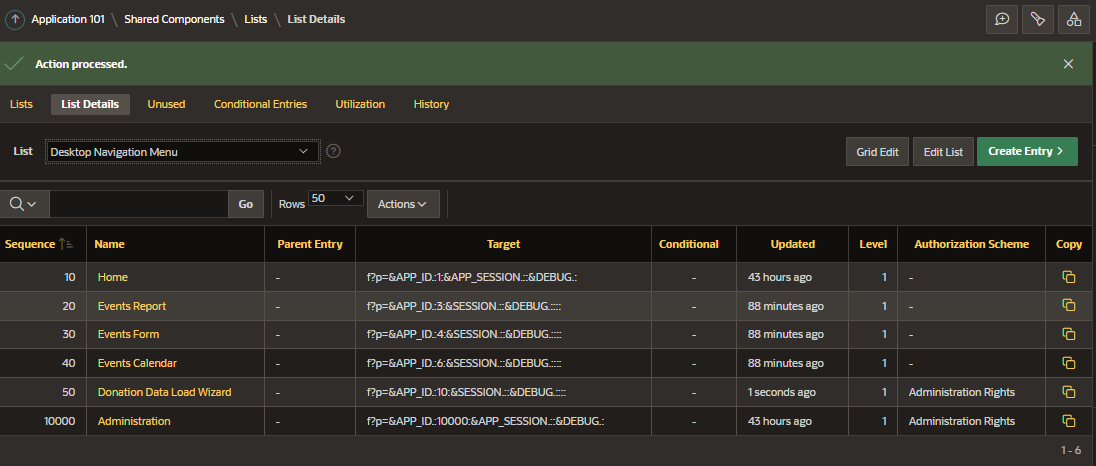
On Navigation Menu you can define an icon to the Donation Data Load Wizard, and set it to be only displayed to Administrators.
-
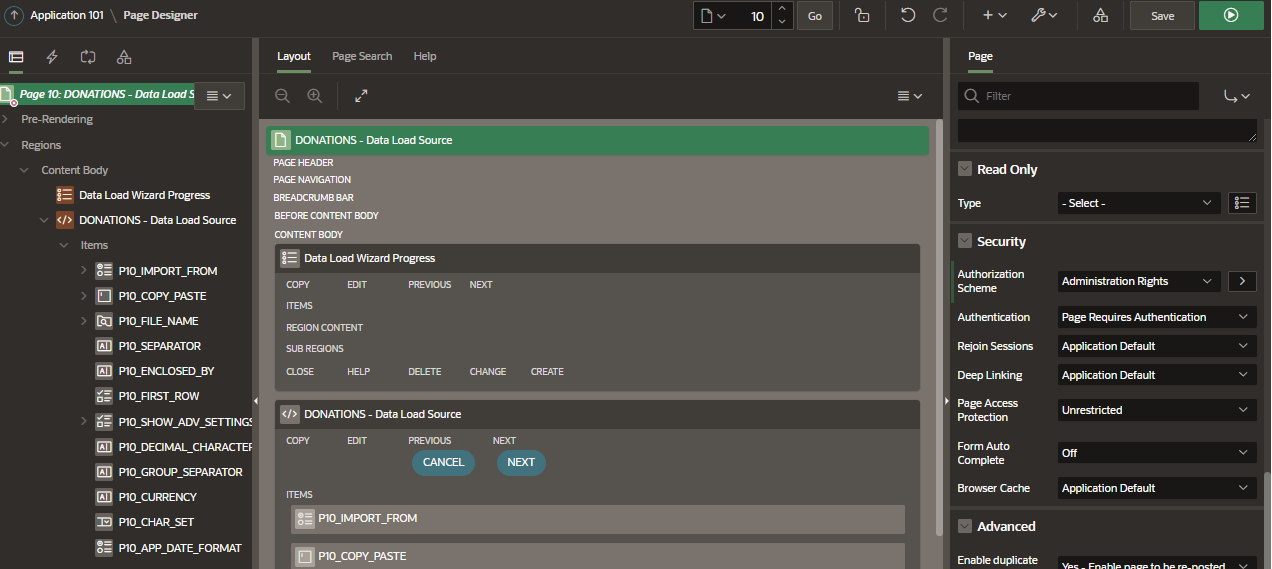
The page should continue to be accessible for any user, because we have only defined the Navigation Menu item as an Administrator's resource. To prevent any user from connecting directly to this page, we should also update its security on Page Designer.
Go to the Data Load Page > Page > Security and set Authorization Scheme to Administration Rights. You can notice that here you could also make a page public, by changing the Authentication option, also available in Security.
We have now edited a lot of Shared Components and created a Data Load Wizard page for the Donations.
Since we now have all the Donation data available on our database, let's create a set of Charts/Graphics to aggregate these values and generate insights from this value. Yes, we are going to create an Analytics page!
-
We could of course create a Chart Page with the help from our APEX, but since we are pretty familiar with Oracle APEX, we are going to choose the Blank Page option, and create everything from scratch.
There is nothing on our Donation Analytics page!
-
Right-click Regions and select Create Region. Name it Donation by Country. Set its Type to be a Chart.
-
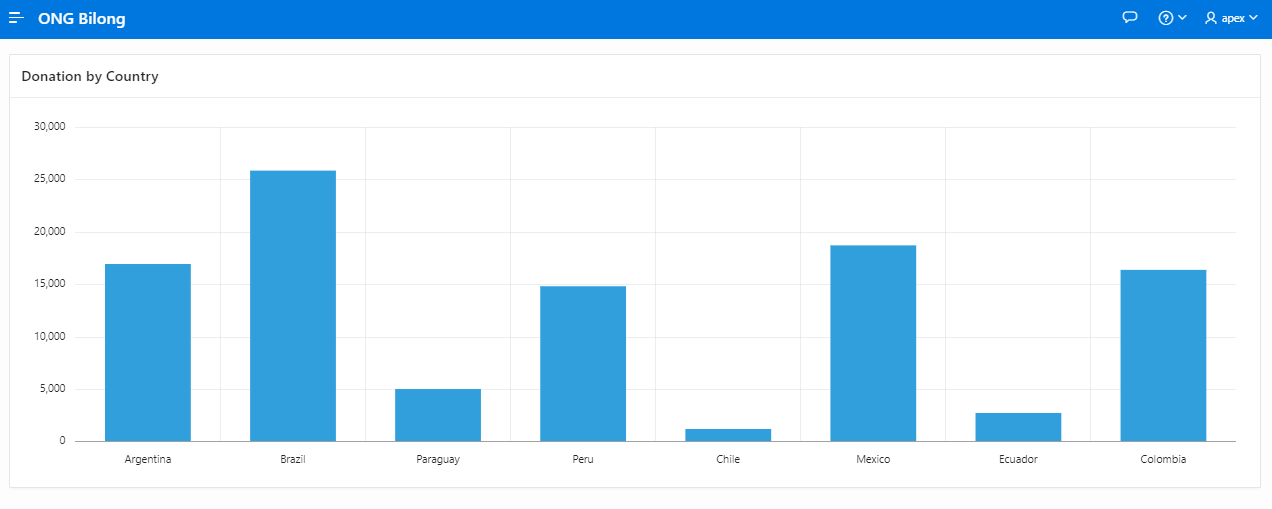
Go to Series > New, and select a Table to be our source. Since we want to display Donations by Country, we will have to create a join between the Event and Donations tables. Thankfully we have already created a View that joins this data. Select the DONATIONS_BY_EVENTS View, and in Column Mapping set Label as COUNTRY, Value Aggregation as Sum and Value as TOTAL_DONATION
-
Save and run it. You will see something like this:
-
Go back to Page Designer and click Donation by Country, go to Attributes and change Chart Type to Pie. Check how it changes the visualization. Change back to Bar and set ORDER BY to TOTAL_DONATION DESC. Now our Series will be displayed in a decreasing order.
-
Now let's check if most Donations are made with Mastercard or Visa Credit Cards.
This information is not available on the View, so we can create another one or Update our View.
Go to SQL Workshop > Object Browser, select Views > Donation by Events > SQL
The following SQL code will be displayed:
CREATE OR REPLACE FORCE EDITIONABLE VIEW "DONATION_BY_EVENTS" ("EVENT", "COUNTRY", "TOTAL_DONATION") DEFAULT COLLATION "USING_NLS_COMP" AS SELECT CITY||'''s '||EVENT_TYPE as EVENT, COUNTRY, SUM(DONATION_AMOUNT) FROM DONATIONS LEFT OUTER JOIN EVENTS ON EVENTS.EVENT_ID = DONATIONS.EVENT_ID GROUP BY CITY||'''s '||EVENT_TYPE, COUNTRY ORDER BY SUM(DONATION_AMOUNT) DESC / -
Go to SQL Workshop > SQL Commands and let's recreate the View, now including the Credit Card Type.
CREATE OR REPLACE FORCE EDITIONABLE VIEW  "DONATION_BY_EVENTS" ("EVENT", "COUNTRY", "CREDIT_CARD_TYPE", "TOTAL_DONATION") DEFAULT COLLATION "USING_NLS_COMP"  AS
SELECT CITY||'''s '||EVENT_TYPE as EVENT, COUNTRY, CREDIT_CARD_TYPE, SUM(DONATION_AMOUNT) FROM DONATIONS
LEFT OUTER JOIN EVENTS
ON EVENTS.EVENT_ID = DONATIONS.EVENT_ID
GROUP BY CITY||'''s '||EVENT_TYPE, COUNTRY, CREDIT_CARD_TYPE
ORDER BY SUM(DONATION_AMOUNT) DESC
/
Your View should be created again.
-
Go back to Page Designer, create a new Region, set it as a Chart and name it Donation by Credit Card Type. Follow the same steps as before, now setting CREDIT_CARD_TYPE as the Label, and using a Pie Chart.
-
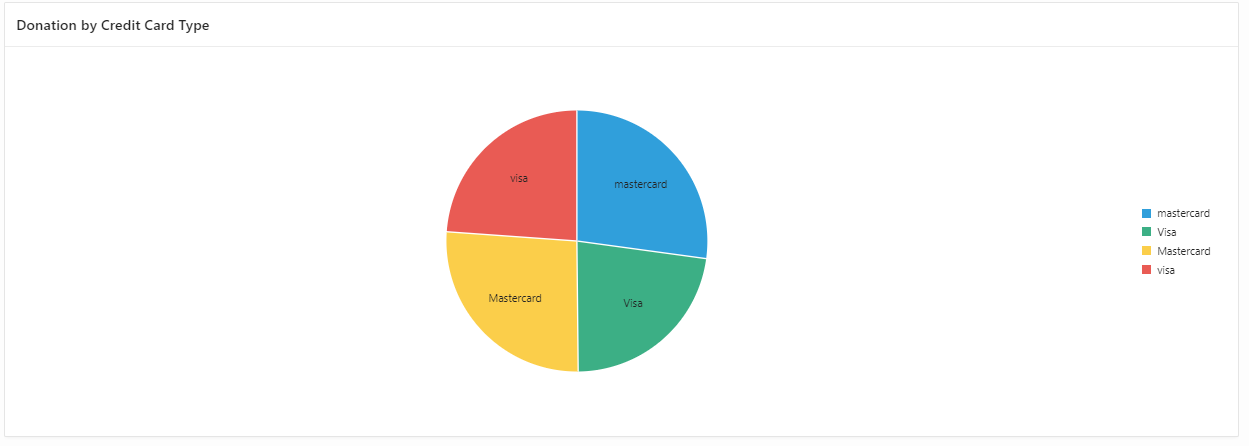
Result was not the expected! There are record beginning with Capital Letters and other without it.
-
Go to SQL Commands again and run the queries:
UPDATE DONATIONS SET CREDIT_CARD_TYPE = 'Visa' WHERE CREDIT_CARD_TYPE = 'visa'
UPDATE DONATIONS SET CREDIT_CARD_TYPE = 'Mastercard' WHERE CREDIT_CARD_TYPE = 'mastercard'
SELECT DISTINCT CREDIT_CARD_TYPE FROM DONATIONS
-
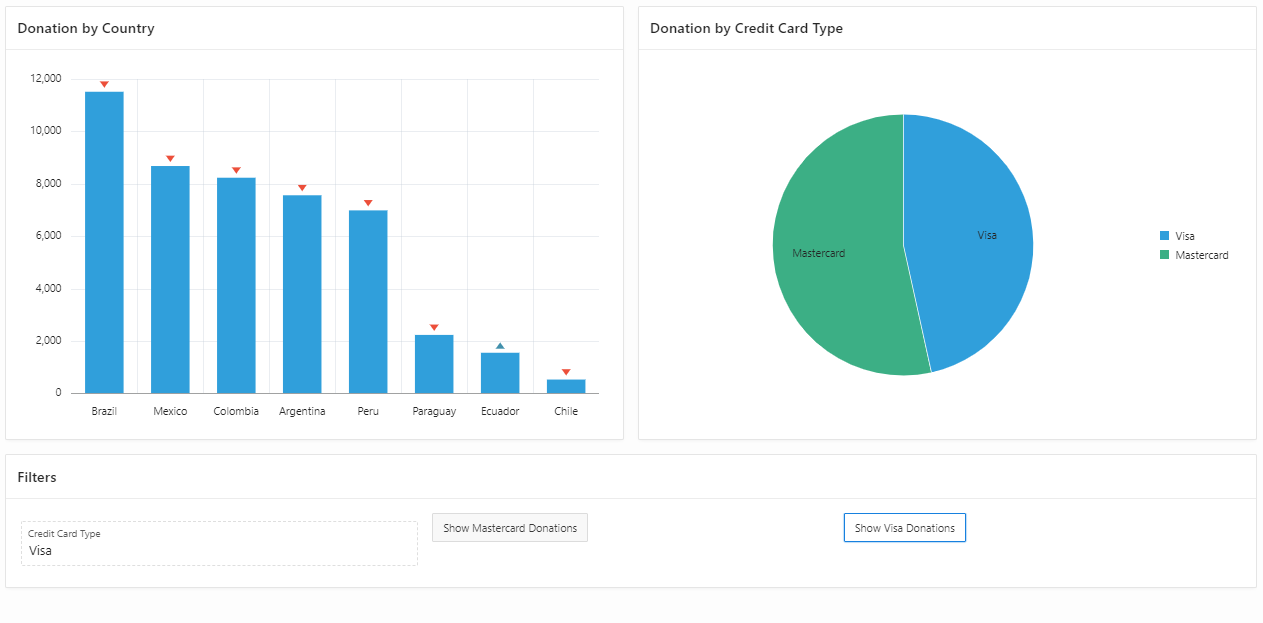
The result now should be OK, and we see that we have more Donations with Mastercard than Visa (it should not matter, but we want to create some kind of chart, right?).
-
Put your Charts side-by-side and create another Region, call it Filters. We are going to create Items inside it, and when the user interacts with it, the whole page will be changed.
Create an Item. Make it a Display Only.
Also create a Button. Name it Show_Mastercard_Donations.
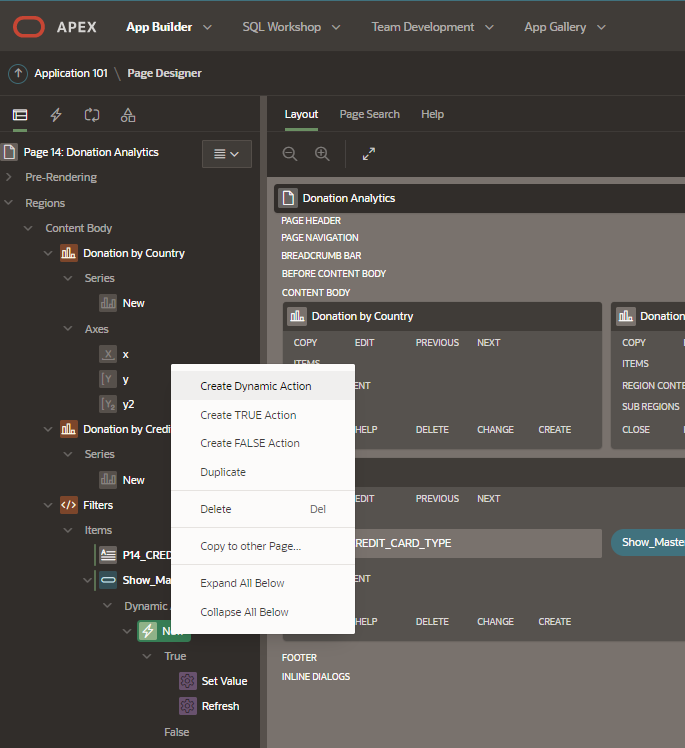
Right-click it and Create Dynamic Action.
Right-click the New and Create TRUE Action.
-
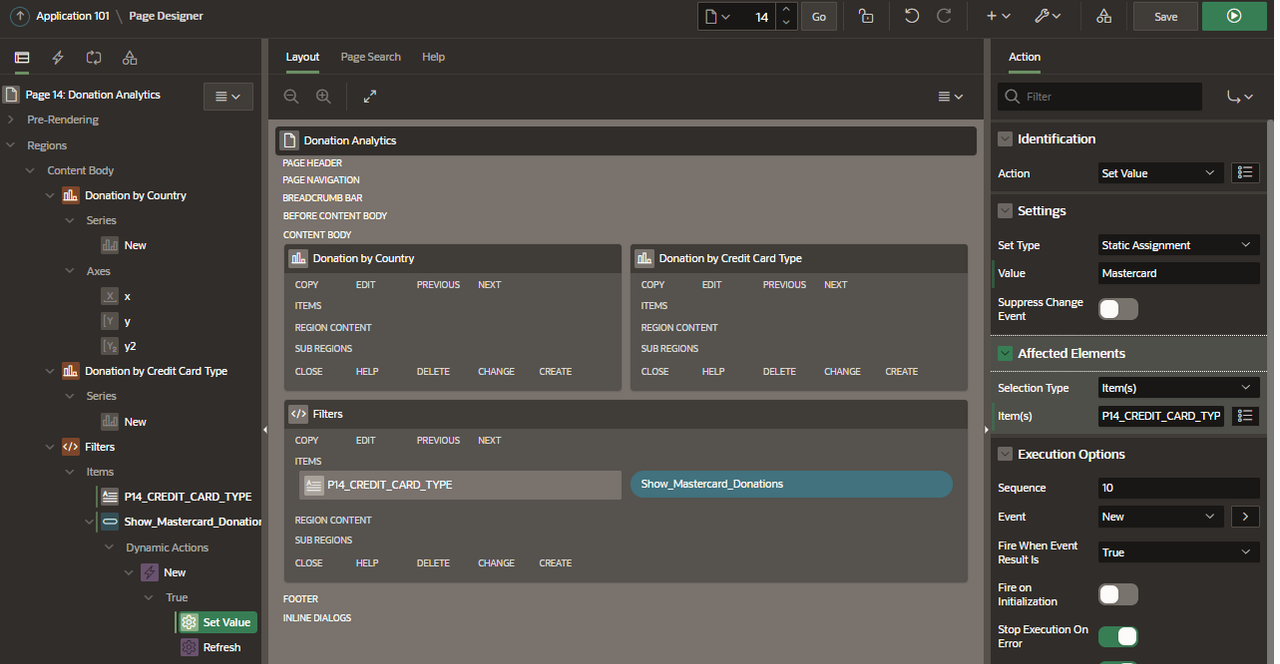
Make a Set Value Action to set the value Mastercard to your Item.
Duplicate your button but make it Visa.
-
Run your page. The button is updating the Display Item but nothing more, right? What is going on? The issue here is that we are not refreshing our charts, and also not using the created Item as a Where Clause. To change it, update the Donation by Country query in Series > New to include the code below in the Where Clause.
(CREDIT_CARD_TYPE = :P14_CREDIT_CARD_TYPE OR :P14_CREDIT_CARD_TYPE IS NULL)
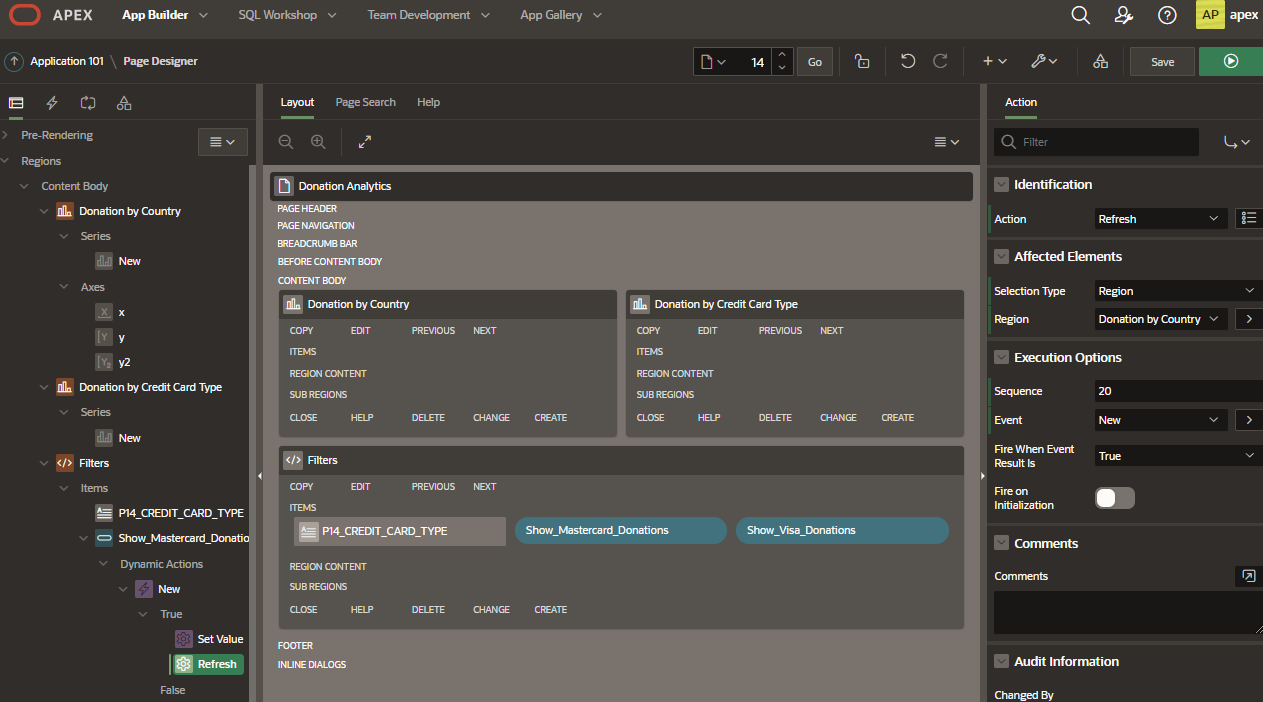
And also create a new TRUE Action in both Buttons, to Refresh the Donation by Country Region:
-
Clicking the Buttons will now Refresh th Bar Chart.
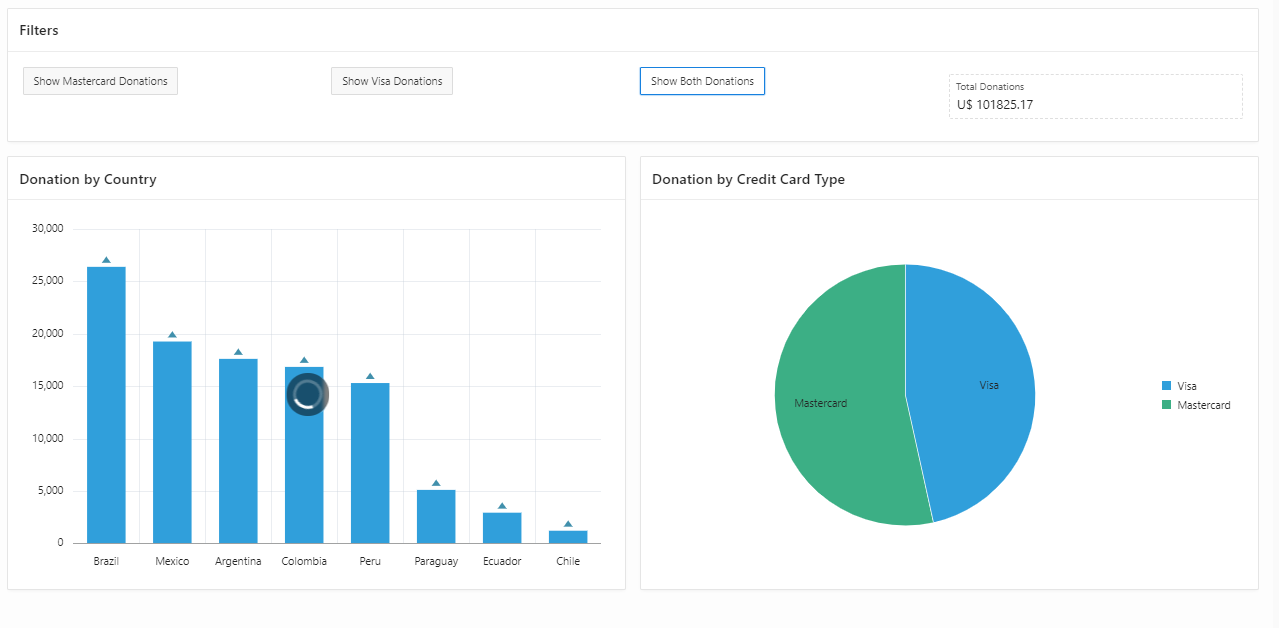
Proceed to Set your Item to Hidden so it will cease to be displayed on screen, and create a new button to show donations with both credit card types (clearing the item and refreshing the Region will do it).
-
You could also create a Total Donations field and calculate it as you filter Visa/Mastercard
In each Dynamic Action you can create another TRUE Action, and set it as:
SELECT 'U$ '||SUM(TOTAL_DONATION) FROM DONATION_BY_EVENTS WHERE (CREDIT_CARD_TYPE = :P14_CREDIT_CARD_TYPE OR :P14_CREDIT_CARD_TYPE IS NULL)
-
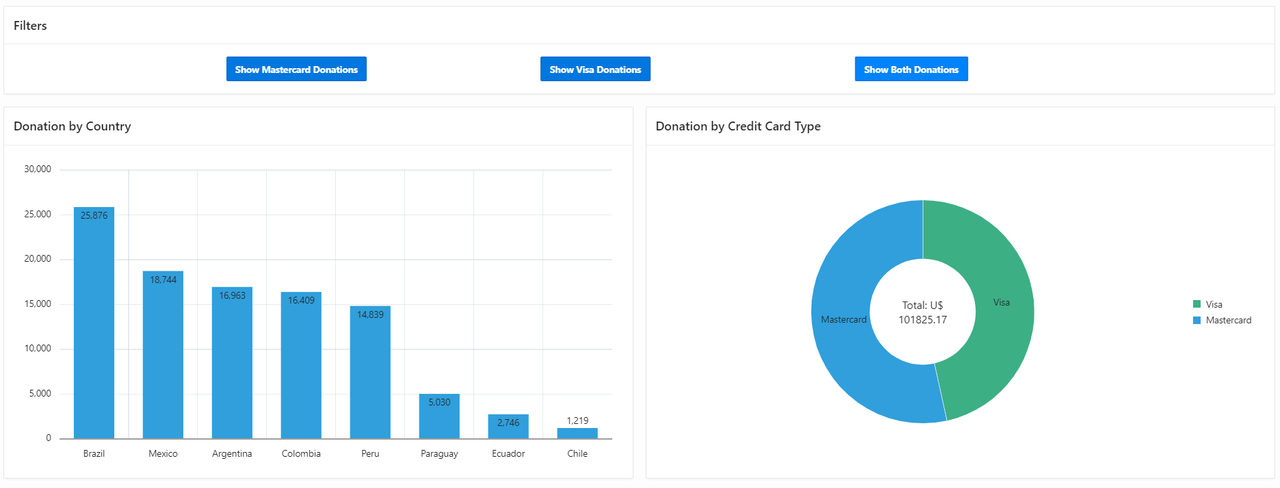
Want the Total Donations Amount to show up inside of the Pie Chart? Also possible.
First of all, make it so both regions are refreshed when you click any button.
Do not forget to update the Where Clause and Page Items to Submit in the Donation by Credit Card Viz. Also change it to a Donut Chart. Check if everything is working as intended.
-
Open the Donut Chart area > Attributes > Advanced > JavaScript Initialization Code. Input the code below (do not forget to change P14_TOTAL_DONATIONS to your Item's name).
    function( options ){
    this.pieSliceLabel = function(dataContext){
        var series_name,
            percent = Math.round(dataContext.value/dataContext.totalValue*100);
    if ( dataContext.seriesData ) {
        series_name = dataContext.seriesData.name;
    } else {
        series_name = 'Other';
    }
    return series_name + " " + percent + "% ( " + dataContext.value + " )";
}

options.dataLabel = pieSliceLabel;

options.pieCenter = {
            label: "Total :" + $x("P14_TOTAL_DONATIONS").value
}
        return options;
}
-
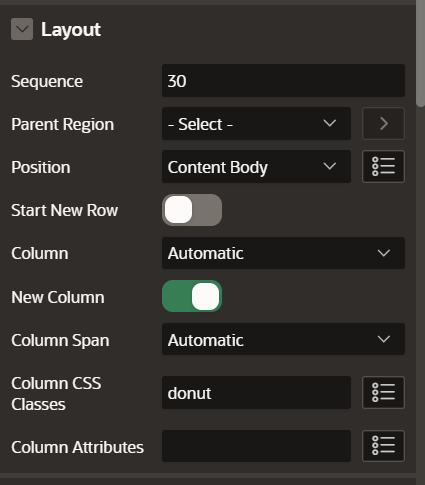
After that, go to Region > Layout and set your Column CSS Classes to donut so it will be easier to reference it.
-
In every button, include a new TRUE Action (you should have 5 by now) and set it as an Execute JavaScript Code Action. Write the code:
$(".donut .oj-chart").ojChart({pieCenter: {label: "Total: " + $x("P14_TOTAL_DONATIONS").value}});
console.log(1);
-
Set your Total Donations Item to be Hidden and execute the page. You have finished your Analytics Page using Dynamic Actions!
Web Services enable applications to interact with one another over the web in a platform-neutral, language independent environment. In a typical Web Services scenario, a business application sends a request to a service at a given URL by using the protocol over HTTP. The service receives the request, processes it, and returns a response. Web Services are typically based on Simple Object Access Protocol (SOAP) or Representational State Transfer (REST) architectures. RESTful Web Services are result oriented. The scope of the Web Service is found in the URI and the method of the service is described by the HTTP method that is used such as GET, POST, PUT, and DELETE.
The RESTful Web Service Wizard is a set of pages in the SQL Workshop area of Oracle Application Express that help you to create a RESTful Web Service declaratively. Once you have defined a RESTful Web Service, you can call it with a unique Uniform Resource Identifier (URI). RESTful Web Services are organized within Oracle APEX through a hierarchy of a module, a resource template and handlers within a template. The resource template includes a prefix for the URI, which is completed with a final portion of the URI defined by the handler.
-
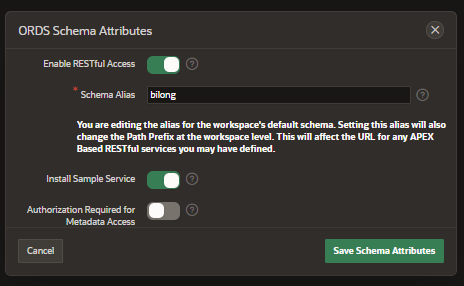
Go to SQL Workshop > RESTful Services, and Register your Schema with ORDS.
-
Name your alias and Save Schema Attributes.
-
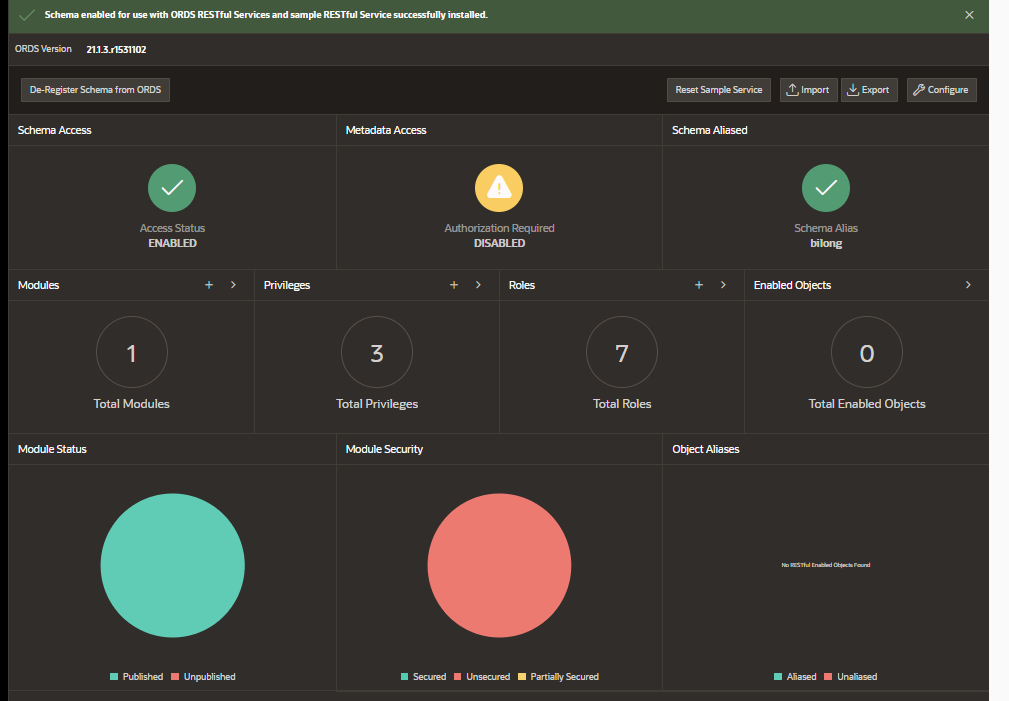
Oracle RESTful Data Services (ORDS) provides a pretty complete and straight-forward dashboard.
-
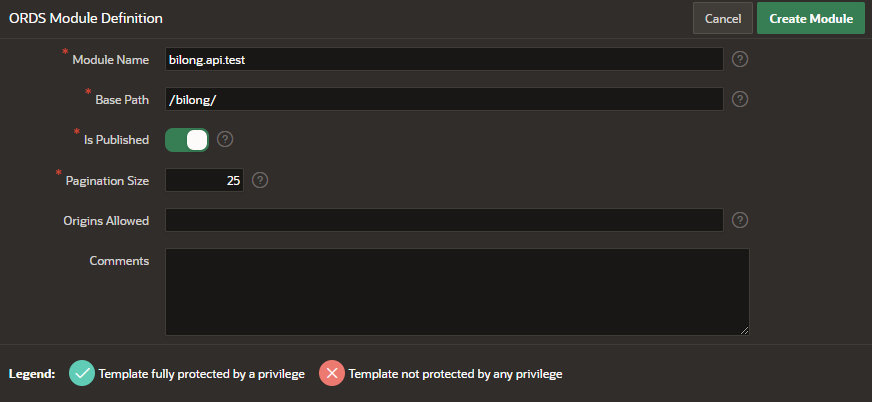
Click Modules and Create Module.
-
Name your Module and give it a Base Path. Then Create Module.
-
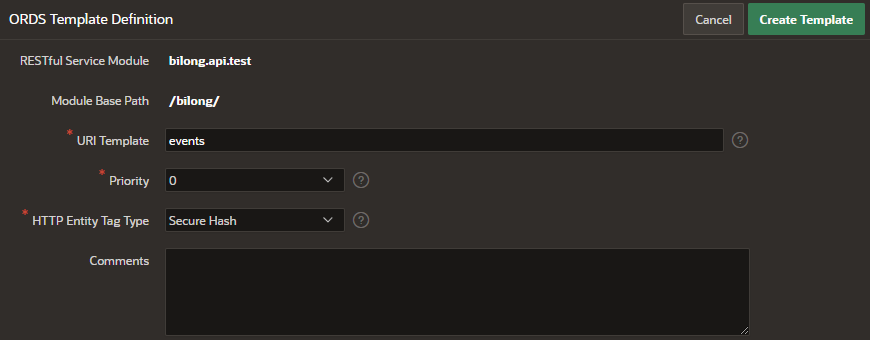
Your Module should be immediately available. Click Create Template. Create an URI Template named events. Click Create Template again.
-
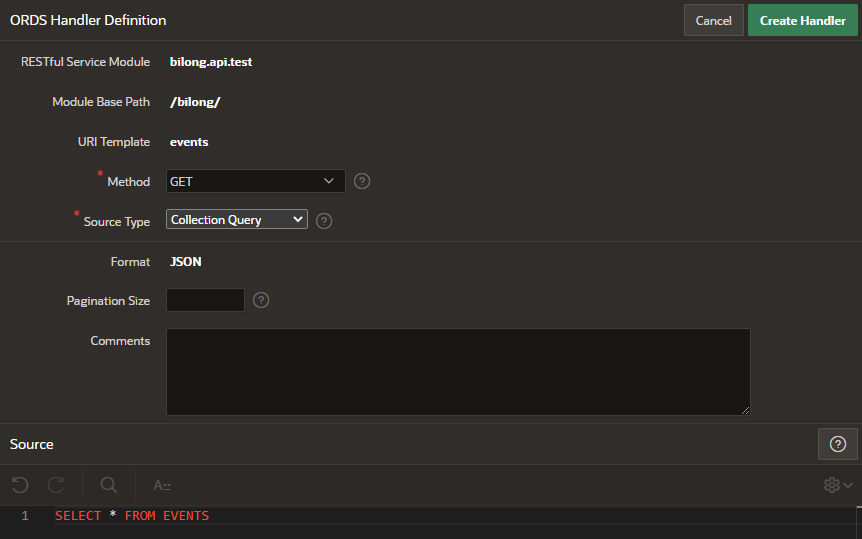
Click Create Handler.
-
Create a GET Method Handler with the following SQL Code in Source:
SELECT * FROM EVENTS
-
Copy the Full URL and open it in a new tab on your browser. Suddenly, your Database Tables can be consumed via REST in a platform-neutral, language independent environment. Any application could query it and use the result as intended.
-
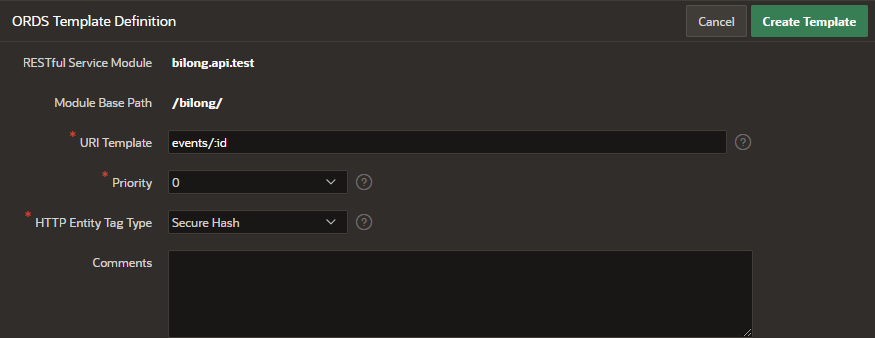
To close things up, let's go back to the bilong.api.test Module and Create a new Template. Set the URI Template to be events/:id. This new template will use a parameter to bring an unique event.
-
Create Handler, and set a new GET Method using the SQL Query below as Source:
SELECT CITY||'''s '||EVENT_TYPE as EVENT FROM EVENTS

WHERE EVENT_ID = :id
-
Copy the Full URL, substitute :id for a number, and test your GET Method.
-
We now have fully complete application with Report, Form, Calendar, Data Load, and Analytics. We understand how to use Plug-Ins, Validations, Processes and Dynamic Actions. Enjoy your new set of tools to create lots of APEX Applications to solve your day-to-day problems.
For any suggestions/feedbacks e-mail me at [email protected]
