A plugin that integrate AppSpector to your Flutter project.
With AppSpector you can remotely debug your app running in the same room or on another continent. You can measure app performance, view database content, logs, network requests and many more in realtime. This is the instrument that you've been looking for. Don't limit yourself only to simple logs. Debugging doesn't have to be painful!
Before using AppSpector SDK in your Flutter app you have to register it on (https://app.appspector.com) via web or desktop app. To use SDK on both platforms (iOS and Android) you have to register two separate apps for different platforms. API keys required for the SDK initialisation will be available on the Apps settings pages
dependencies
appspector: '0.10.0'import 'package:appspector/appspector.dart';
void main() {
WidgetsFlutterBinding.ensureInitialized();
runAppSpector();
runApp(MyApp());
}
void runAppSpector() {
final config = Config()
..iosApiKey = "Your iOS API_KEY"
..androidApiKey = "Your Android API_KEY";
// If you don't want to start all monitors you can specify a list of necessary ones
config.monitors = [Monitors.http, Monitors.logs, Monitors.screenshot];
AppSpectorPlugin.run(config);
}Build your project and see everything work! When your app is up and running you can go to https://app.appspector.com and connect to your application session.
After calling the run method the SDKs start data collection and
data transferring to the web service. From that point you can see
your session in the AppSpector client.
Since plugin initialization should locate in the main function we provide
methods to help you control AppSpector state by calling stop() and start() methods.
You are able to use these methods only after AppSpector was initialized.
The stop() tells AppSpector to disable all data collection and close current session.
await AppSpectorPlugin.shared().stop();The start() starts it again using config you provided at initialization.
await AppSpectorPlugin.shared().start();As the result new session will be created and all activity between
stop() and start() calls will not be tracked.
To check AppSpector state you can use isStarted() method.
await AppSpectorPlugin.shared().isStarted();You can assign a custom name to your device to easily find needed sessions
in the sessions list. To do this you should add the desired name as a value
for MetadataKeys.deviceName key to the metadata dictionary:
void runAppSpector() {
  var config = new Config()
    ..iosApiKey = "Your iOS API_KEY"
    ..androidApiKey = "Your Android API_KEY"
    ..metadata = {MetadataKeys.deviceName: "CustomName"};

  AppSpectorPlugin.run(config);
}
Also, the plugin allows managing the device name during application lifetime using
the setMetadataValue method to change device name
AppSpectorPlugin.shared().setMetadataValue(MetadataKeys.deviceName, "New Device Name");or the removeMetadataValue to remove your custom device name
AppSpectorPlugin.shared().removeMetadataValue(MetadataKeys.deviceName);Sometimes you may need to get URL pointing to current session from code. Say you want link crash in your crash reporter with it, write it to logs or display in your debug UI. To get this URL you have to add a session start callback:
AppSpectorPlugin.shared()?.sessionUrlListener = (sessionUrl) => {
// Save url for future use...
};The SQLite monitor on Android demands that any DB files are located at the database folder.
So, if you're using sqflite the code for opening db will be looks like that:
var dbPath = await getDatabasesPath() + "/my_database_name";
var db = await openDatabase(dbPath, version: 1, onCreate: _onCreate);
The getDatabasesPath() method is imported from package:sqflite/sqflite.dart.
AppSpector provides many monitors that are can be different for both platforms.
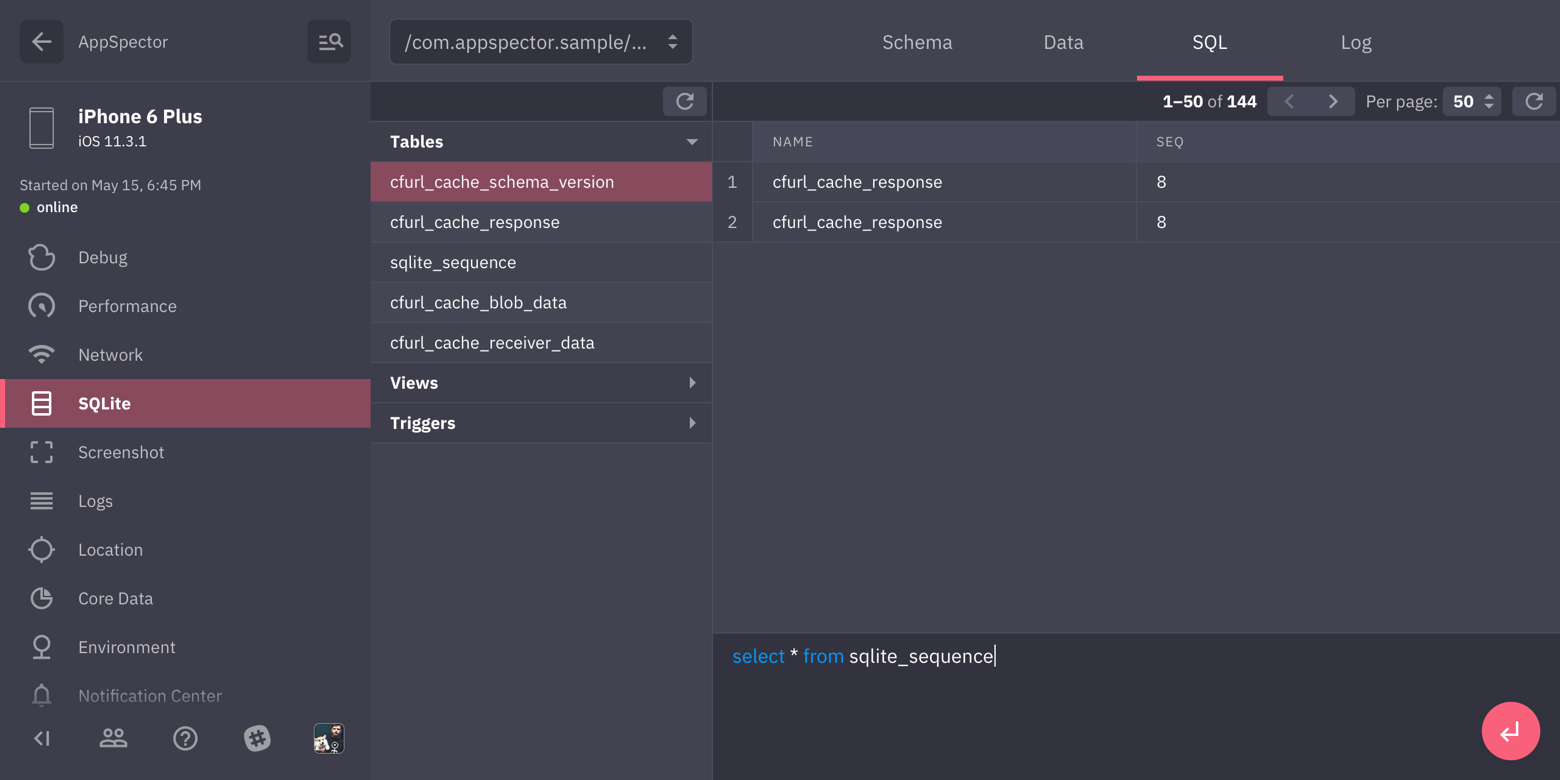
Provides browser for sqlite databases found in your app. Allows to track all queries, shows DB scheme and data in DB. You can issue custom SQL query on any DB and see results in browser immediately.
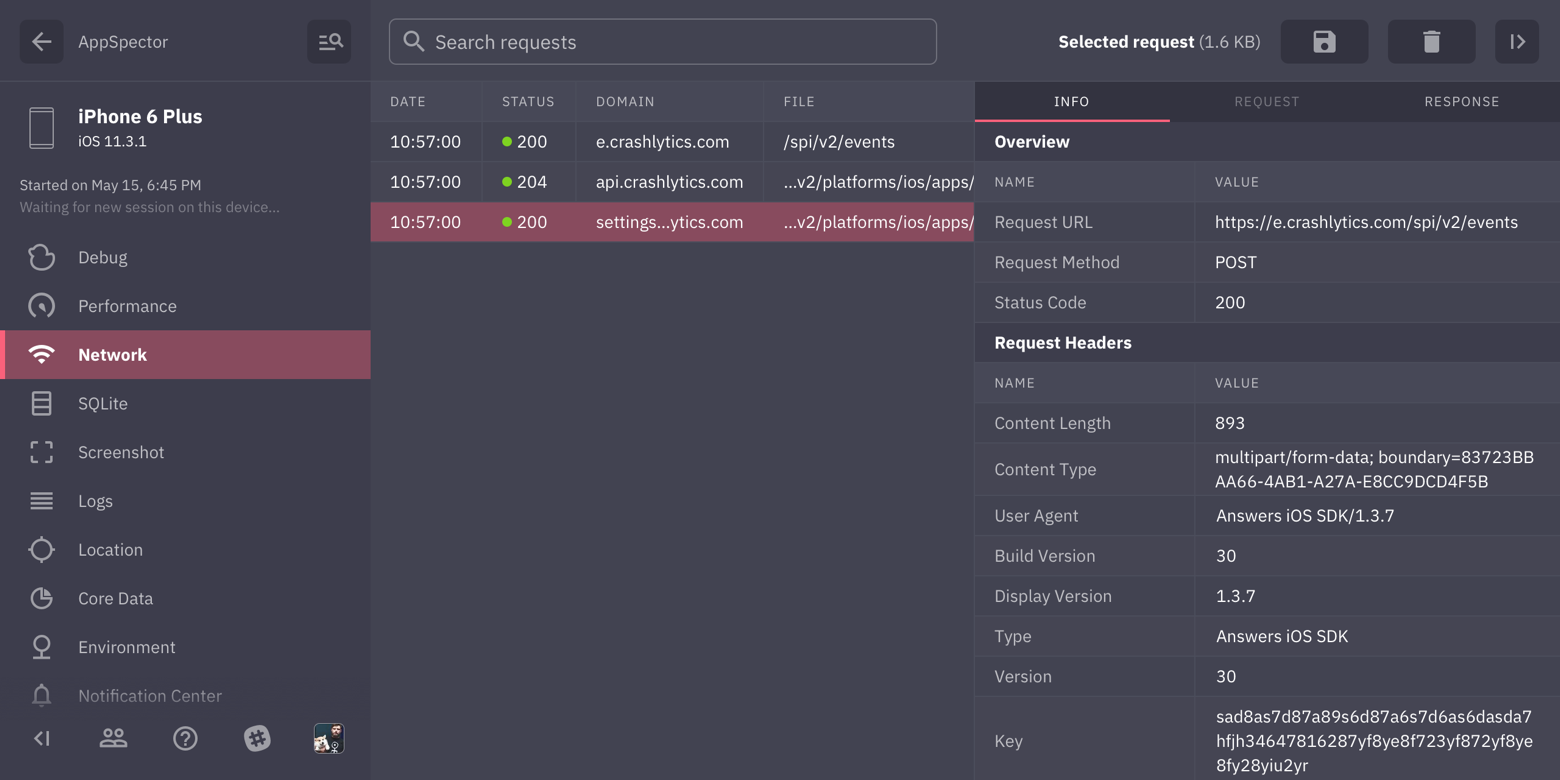
Shows all HTTP traffic in your app. You can examine any request, see request/response headers and body. We provide XML and JSON highliting for request/responses with formatting and folding options so even huge responses are easy to look through.
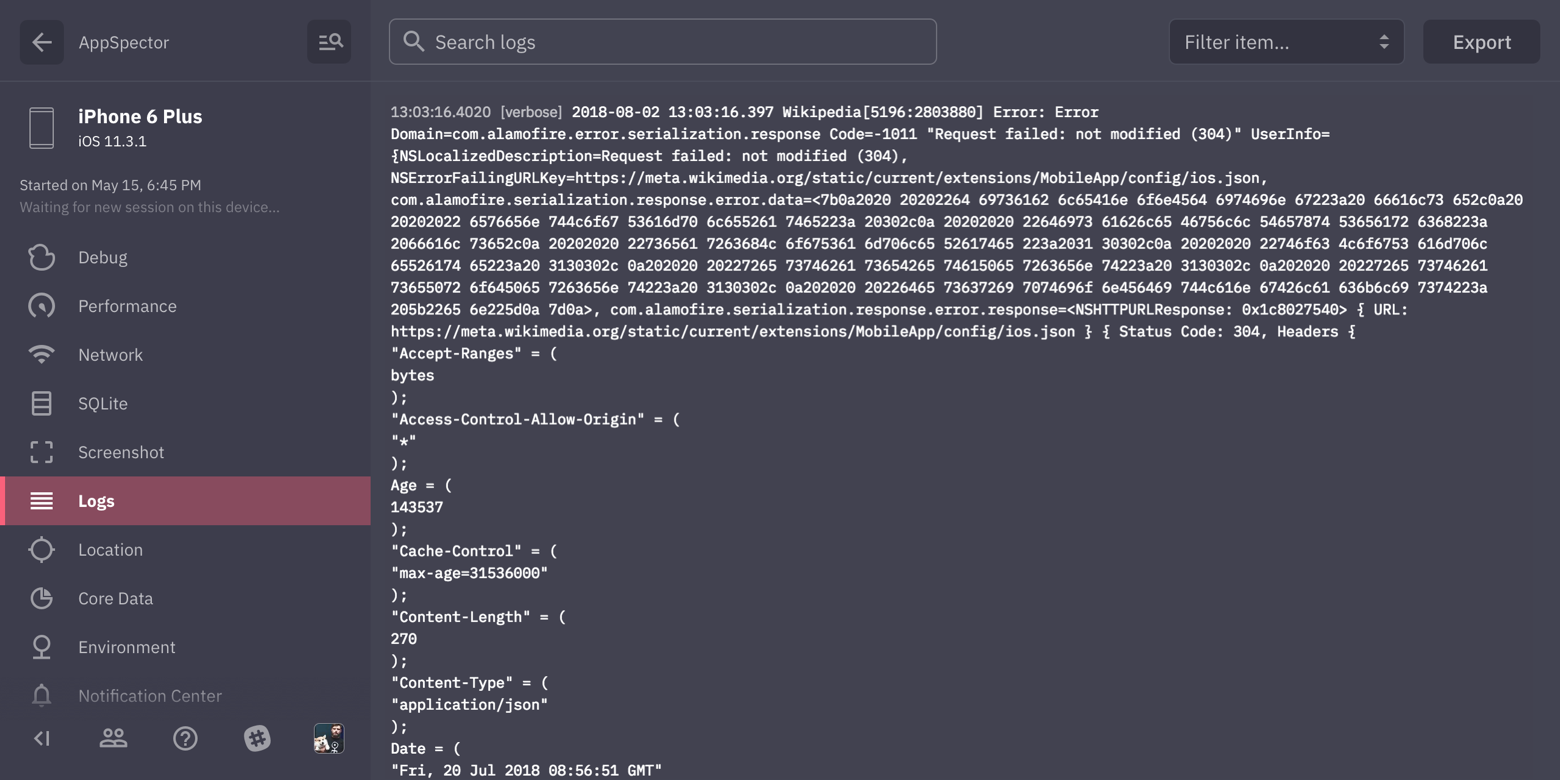
Displays all logs generated by your app.
AppSpector Logger allows you to collect log message only into AppSpector service. It is useful when you log some internal data witch can be leaked through Android Logcat or similar tool for iOS.
It has a very simple API to use:
Logger.d("MyTAG", "It won't be printed to the app console");Don't forget to import it from package:appspector/appspector.dart.
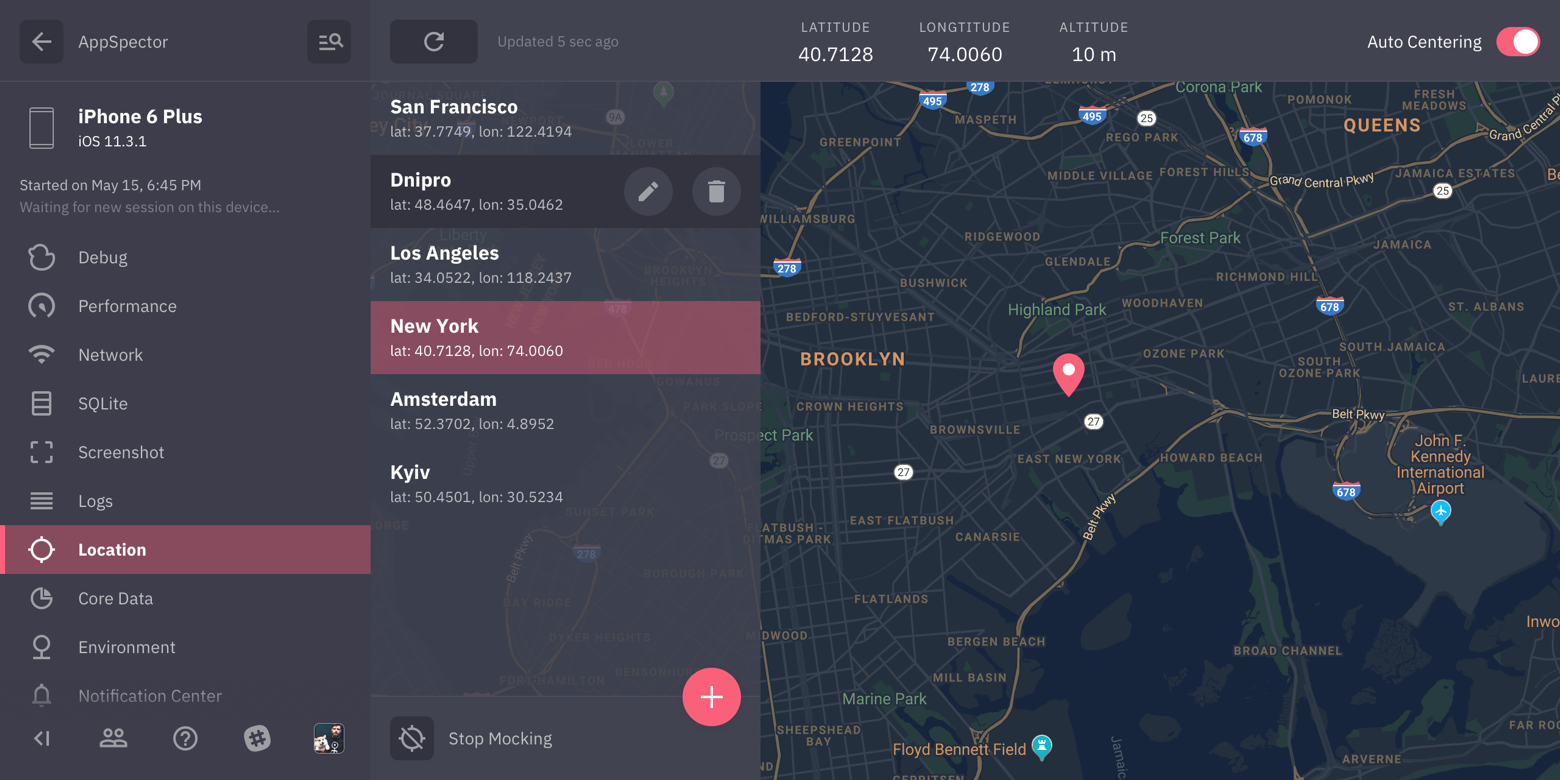
Most of the apps are location-aware. Testing it requires changing locations yourself. In this case, location mocking is a real time saver. Just point to the location on the map and your app will change its geodata right away.
Simply captures screenshot from the device.
Provides browser and editor for SharedPreferences/UserDefaults.
Displays real-time graphs of the CPU / Memory/ Network / Disk / Battery usage.
Gathers all of the environment variables and arguments in one place, info.plist, cli arguments and much more.
Tracks all posted notifications and subscriptions. You can examine notification user info, sender/reciever objects, etc. And naturally you can post notifications to your app from the frontend.
Provides access to the application internal storage on Android and sandbox and bundle on iOS. Using this monitor you're able to download, remove or upload files, create directories and just walk around your app FS.
For mode details, you can visit Android SDK and iOS SDK pages.
Let us know what do you think or what would you like to be improved: [email protected].


