The repository contains immune repertoire sequencing (RepSeq) datasets produced using different library prepartion techniques. The main goal of this project is to compare various molecular methods for antigen receptor sequencing.
General comments regarding data analysis presented here:
-
Only T-cell receptor repertoires are considered.
-
The datasets are stored as clonotype frequency tables and contain the following columns: read (or cDNA) count, Variable/Diversity/Joining segments in IMGT format, nucleotide and amino acid sequence of the CDR3 region.
-
Each dataset should have a corresponding metadata file holding information on T-cell source, the amoung of input DNA/cDNA, sequencing platform, brief description of the protocol, TCR chain (alpha or beta) and data pre-processing pipeline. Note that an optimal pre-processing method is chosen for each technology, comparison of bioinformatic methods (V-D-J mapping, etc) is out of scope of this repository.
The generic set of samples is the following:
-
PBMCs from the same donor are used, split at the RNA level and distributed across participants
-
Three large (100ng RNA) and small (10ng RNA) samples are used for generating technical replicas with a given library preparation protocol
General ideas for in silico protocol comparison:
-
Library preparation techniques are compared based on their ability to resolve V-D-J junctions in an unbiased and comprehensive way, as well as the robustness of clonotype frequency quantification. Comparison parameters are listed below.
-
An example dataset and its analysis is provided in the
examples/folder.
TBA
Basic repertoire characteristics include diversity (number of unique clonotypes and the number of unseen clonotypes), Variable (V) and Joining (J) segment frequencies, preferences in V-J pairing and CDR3 length distribution.
The following metrics can be compared across various library preparation protocols.
The following commonly used diversity metrics can be compared across replicas, input RNA amount and protocols:
-
Chao1 index
-
Shannon index
-
Gini index
Additionally, rarefaction curves can be compared visually.
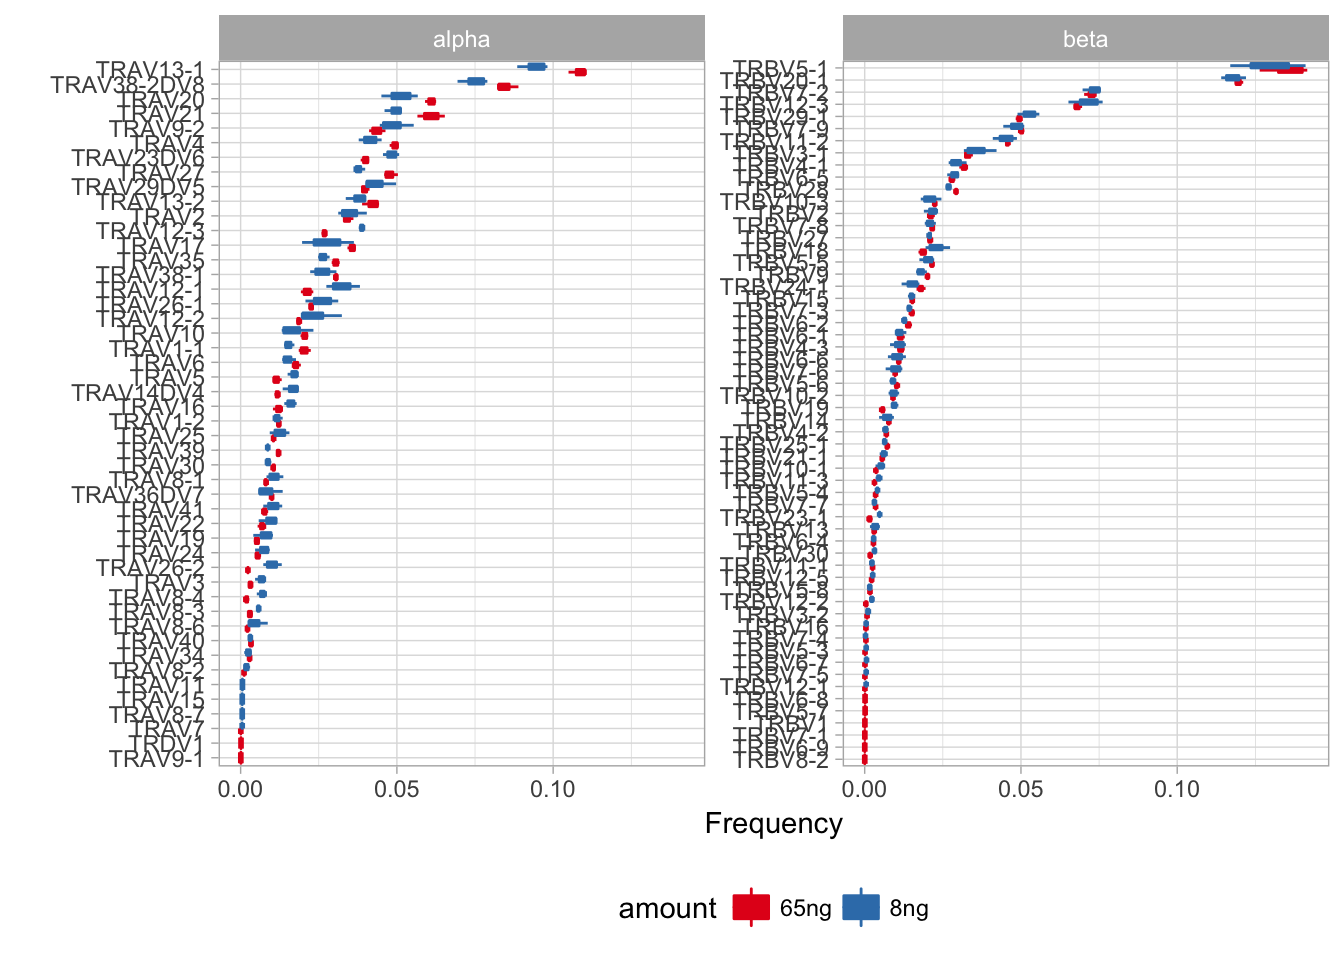
Deviations in Variable and Joining segment usage reflects the potential biases in library preparation for certain segments (amplification bias, etc).
In this section only V/J segments are considered, allelic variants (*02,*03,.. in IMGT notation) are ignored.
-
Compare V and J frequency distributions, both weighted (by read) and unweighted (by clonotype, i.e. unique CDR3)
-
Compare frequency of V-J junctions, weighted and unweighted
-
Perform 2-way ANOVA test and post-hoc T-test to detect V and J segments that are under- or over-samples by certain technologies
CDR3 length distribution can be biased in case of short reads and specific Joining segment primers that fall inside CDR3 region.
-
Compare the CDR3 length distribution. This can be done either visually, or using mean and standard deviation as a typical spectratype is bell-shaped.
-
Compare the number of out-of-frame V-J junctions
Some parameters can be computed from replicate experiments performed using the same protocol and compared across protocols, for example:
-
Compare the variance of Chao1 diversity index across samples. Chao1 metric describes the diversity of naive cells using the count of singletons and doubletons and is very sensitive to these numbers.
-
Compare the number of unique V-J pairs detected in one, two, etc replicas and the variance of V, J and V-J pair frequency (weighted by read) across replicas.
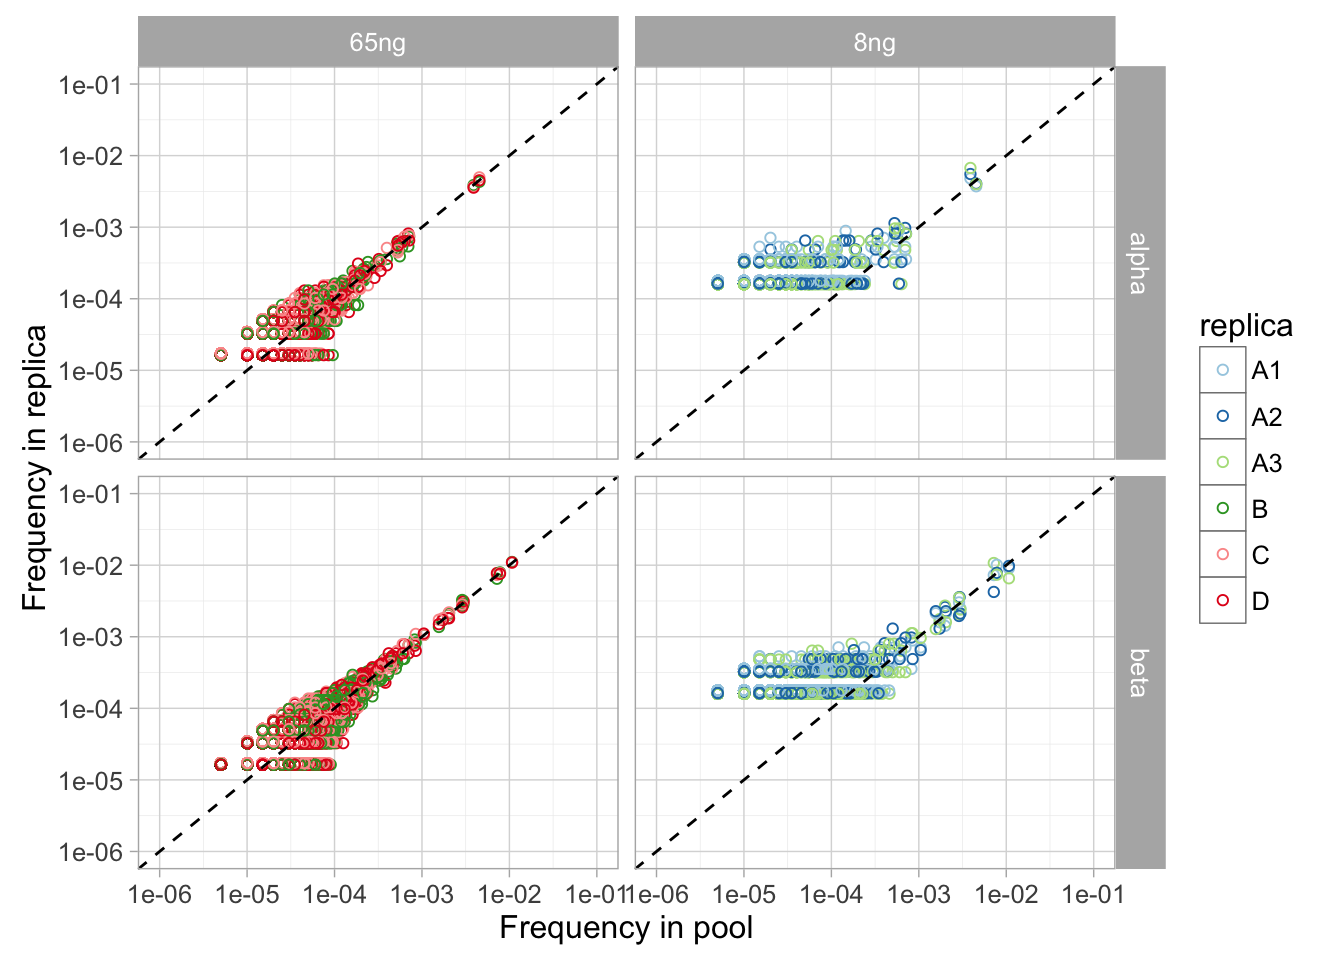
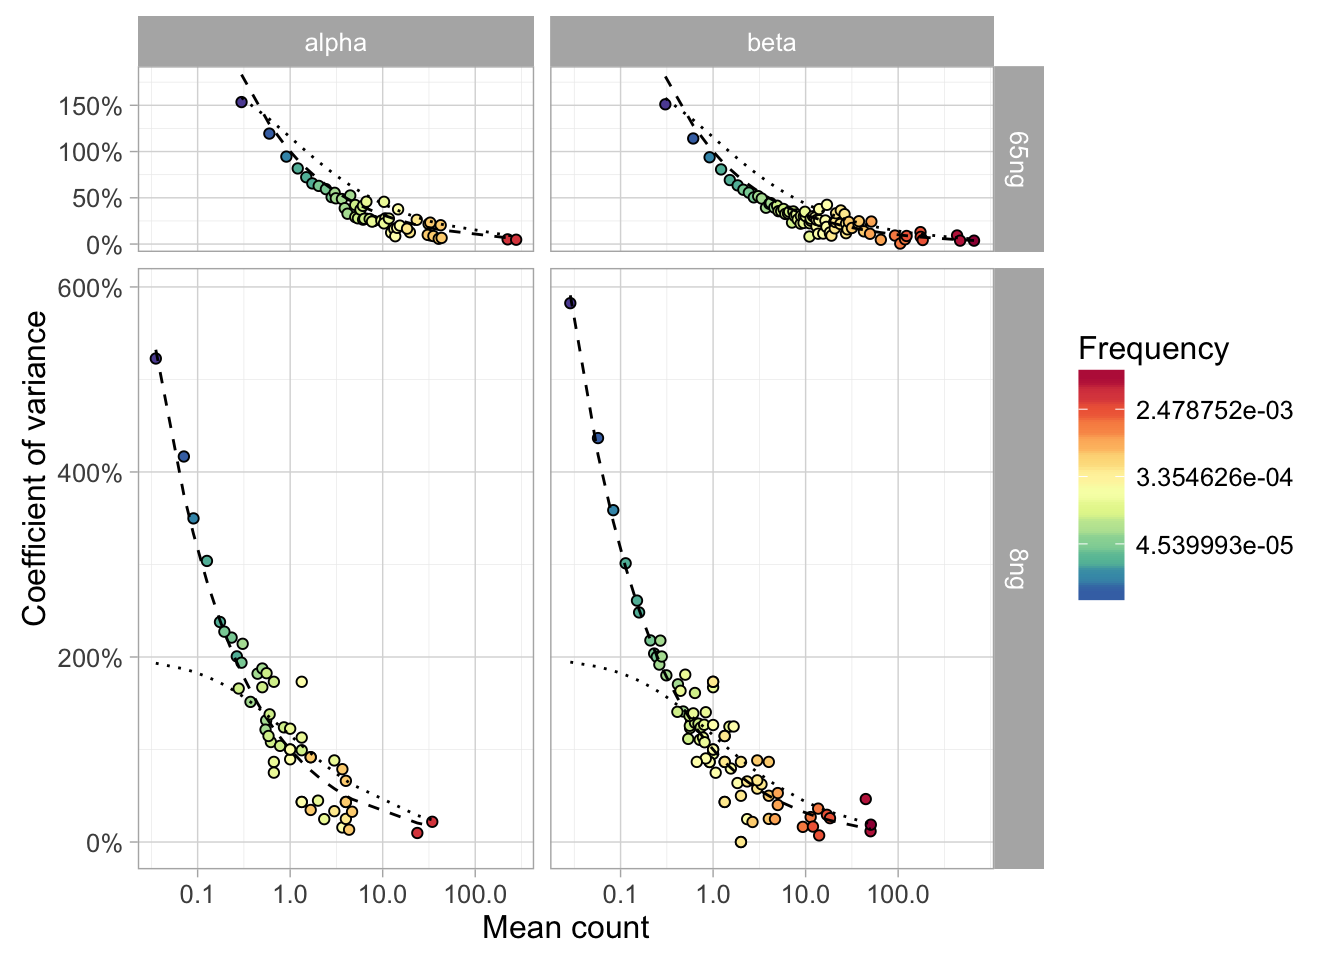
The basic idea of this benchmark is to compare the robustness of T-cell clonotype quantification and to derive a model for clonotype abundance distribution each technology. This model (hereafter called sampling model) should describe the variance of clonotype abundance (for large clonotypes) and the samling probability (for small ones) under the null hypothesis of replicate sampling.
-
The model should describe the dependence between clonotype frequency standard deviation
SDand mean clonotype frequencyM. Ideally, larger clonotypes should have less relative variance, while smaller clonotype sampling should be explained by Poisson model. The deviation from expectedV/Mrelation can be used to assess protocol robustness. -
A model based on read counts and their variance (discrete one) can be applied to rare clonotypes. The probability of missing a clonotype of a given read count due to sampling stochastics can also be calculated from this model.
- Coefficients of variance
SD/Mcan be compared across technologies.
NOTE: While small clonotypes are likely to be described well with Poisson/Binomial models, variance in larger clonotype frequencies could be due to other factors such as TCR gene expression and cell clumping. The latter can be quantified using an empirical model based on log frequencies.


