This project aims to optimize and managing an Nano grid with RES and BESS via IoT collected data.
Climate change is one of the most discussed areas the few last years since the worldwide policies has expressed intention to reduce CO2 emissions. The plan is to achieve the Net zero by 2050 but before that to reduce GHG by almost 45% by 2030 according to Paris Agreement to keep global warming to no more than 1.5°. However, to achieve this targets requires optimizing the resources in way to promote renewable energy usage and storing energy efficiently.
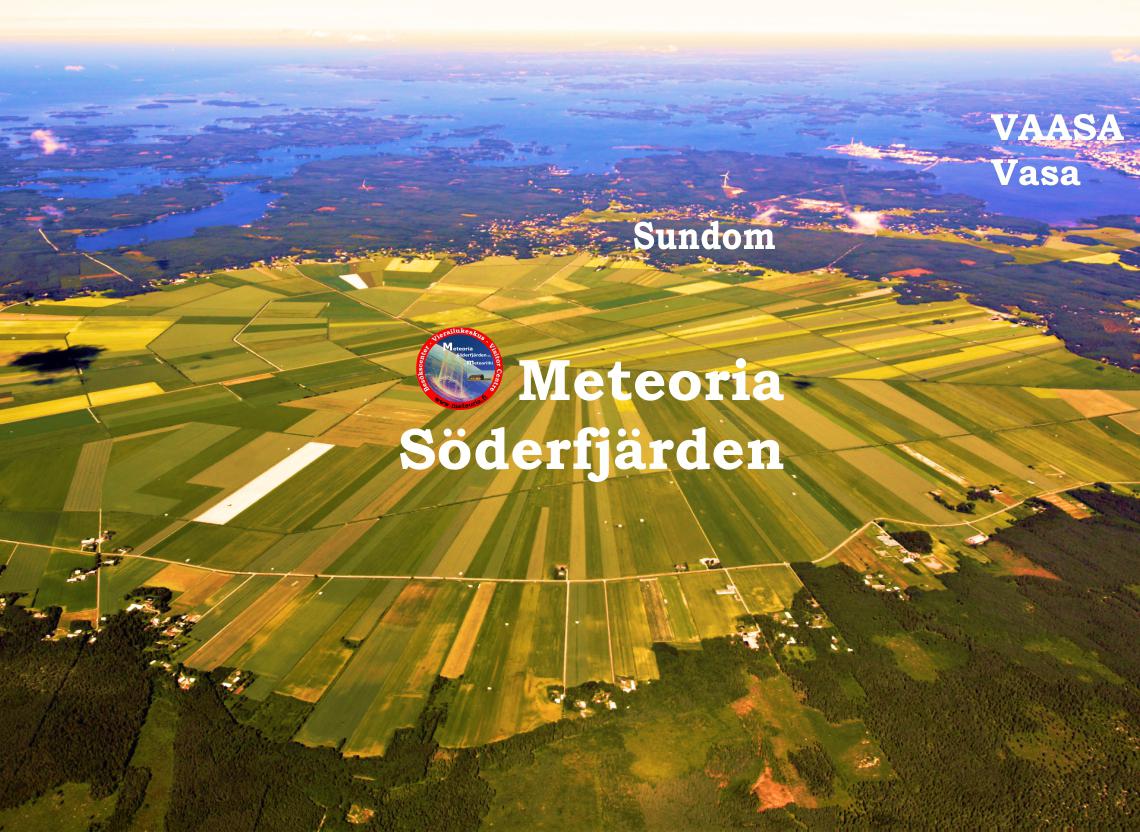
The Meteoria of Sodenfiarden in the suburbs of city of Vaasa is a small exhibition and observatory that help researchers and scientists to observe astronomical objects and do their space observation experiments. The Meteoria is an off-grid nano grid facility which depends on its own resources to satisfy its needs in term of electricity supply. Equipped with Solar PV panels, wind turbine, a DG and a battery storage system.

- To produce a software-based opimizer that will solve the energy optimization problem.
- To Integrate the optimizer model within the Novia IoT platform.
- To deploy the application and visualize the power flow in Meteoria Söderfjärden Visitor Centre on reel time.
The data needed for this project is gathered as following :
- Meteoria weather station.
- FMI (Aeroport of Vaasa).
- Novia DB.
- Novia IoT platform via MQTT.
- Technical documentation.
- Previous work on the site.
First, formulating a solvable linear problem based on some constraints, variables and an objective function, then solving the problem using and X solver and finally testing the end results.
We can start with DAQ as data pipline which feeds the optimizer with the required data as inputs. Then formatting IoT forecasted Data to match the datatype and format used with the Optimizer. and finally populating the optimization output (decision) values within the IoT platform.
Deploying the forecasted Data and the internal IoT network measurements as well as the optimizer outputs data within one visualization web application.
