| title | week | type | subtitle | reading | tasks | ||||
|---|---|---|---|---|---|---|---|---|---|
Farthest airport from New York City |
4 |
Case Study |
Joining Relational Data |
|
|
- R4DS Chapter 13 - Relational Data{target='blank'}
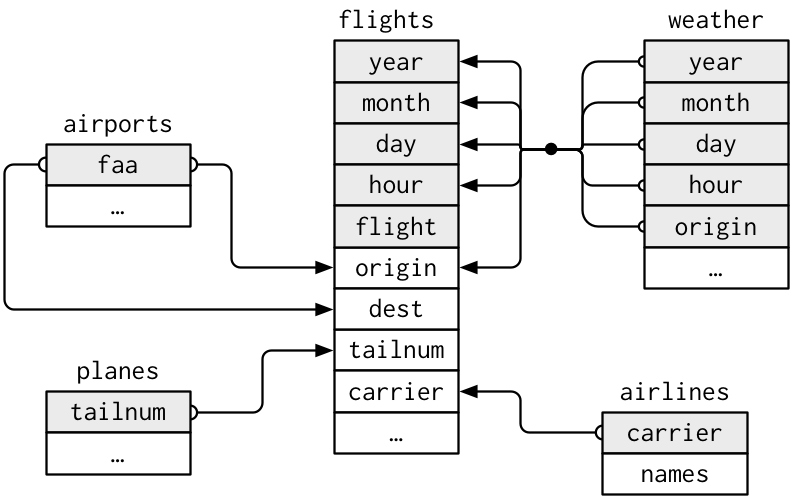
In this exercise you will use various data wrangling tools to answer questions from the data held in separate tables. We'll use the data in the nycflights13 package which has relationships between the tables as follows.
What is the full name (not the three letter code) of the destination airport farthest from any of the NYC airports in the
flightstable?
- Join two datasets using a common column
- Answer a question that requires understanding how multiple tables are related
- Save your script as a .R or .Rmd in your course repository
You will need to load the necessary packages
library(tidyverse)
library(nycflights13)
Download starter R script (if desired){target="_blank"}
There are several ways to do this using at least two different joins. I found two solutions that use 5 or 6 functions separated by pipes (%>%). Can you do it in fewer?
- Open the help file for the
nycflights13package by searching in the "Help" panel in RStudio. - Look at the contents of the various tables to find the ones you need (
name,distance, anddest). You can usehead(),glimpse(),View(),str(). - In the table with distances, find the airport code that is farthest from the New York Airports (perhaps using
arrange()andslice()) - Join this table with the one that has the full airport names. You will either need to rename the columns so they match the other table or use the
byparameter in the join. e.g. check out?left_join() select()only thedestNamecolumn
Soon we will introduce working with spatial data and doing similar kinds of operations. If you have time to play, see if you can figure out what this does:
airports %>%
  distinct(lon,lat) %>%
  ggplot(aes(lon, lat)) +
    borders("world") +
    geom_point(col="red") +
    coord_quickmap()
Can you figure out how to map mean delays by destination airport as shown below?
## `summarise()` regrouping output by 'name', 'lat' (override with `.groups` argument)
Adapted from R for Data Science


